
Fig. 2.
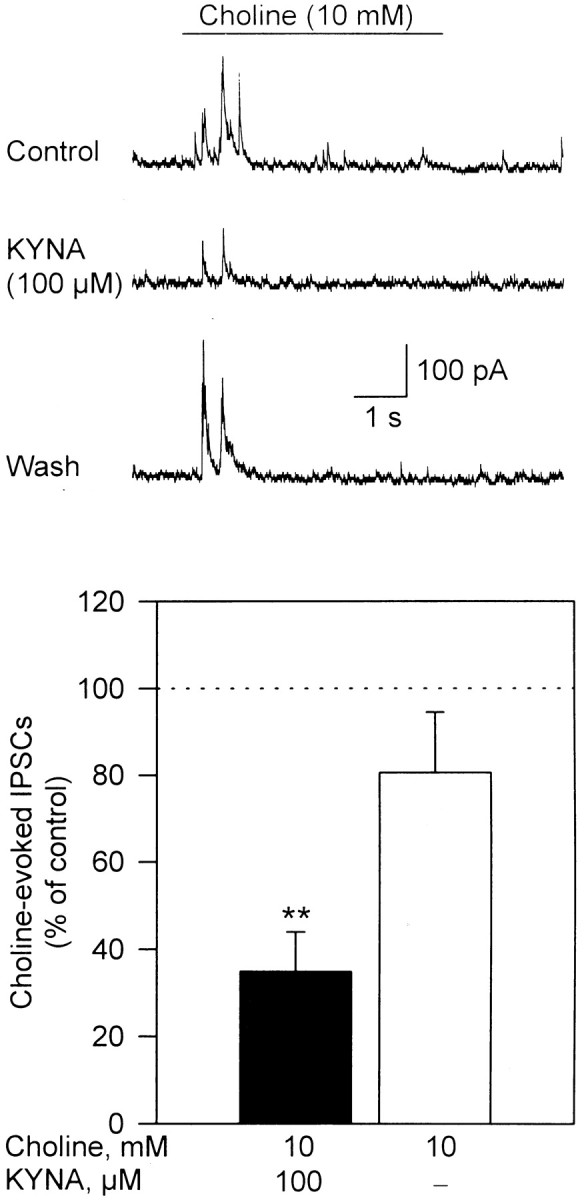
KYNA-induced blockade of IPSCs evoked by choline in cultured hippocampal neurons. Sample recordings of choline (10 mm)-evoked IPSCs obtained before (Control), after 10 min perfusion of the hippocampal neurons with external solution containing KYNA (100 μm), and after 20 min washing of the neuron with external solution (Wash) are shown. Recordings were obtained in the presence of atropine (1 μm), CNQX (10 μm), and APV (50 μm). Membrane potential, +40 mV. Graph shows quantification of the effect of KYNA on choline-triggered IPSCs. Total charge carried by IPSCs triggered by choline was estimated by the area under the curve during the 5 sec pulse application of choline. The total charge of choline-evoked IPSCs recorded before exposure of the neurons to KYNA was taken as 100% and used to normalize the responses recorded in the presence of KYNA and after washing of the neurons. Each graph bar and error bar represent mean and SEM, respectively, of results obtained from three neurons. **p < 0.01 (paired Student'st test).