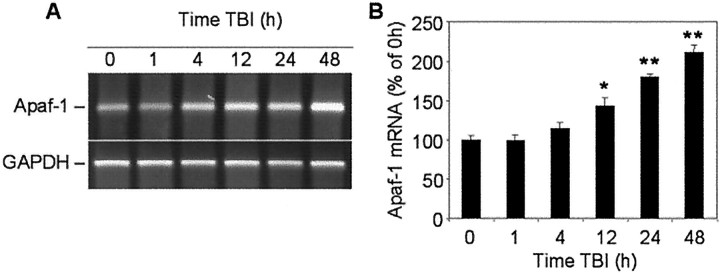
Fig. 8.
Time course of Apaf-1 mRNA expression in rat cortex at indicated times after TBI or in sham-operated controls (0 hr). A, Levels of mRNA were measured by using semiquantitative RT-PCR as indicated in Materials and Methods.B, Levels of Apaf-1 mRNA are expressed as the proportion of individual RT-PCR product mean optical density to GAPDH RT-PCR product optical density of the same RNA sample. mRNA content is expressed as a percentage of sham controls ± SEM (n = 5). *p < 0.05; **p < 0.005, compared with control, by ANOVA, followed by Dunnett's test.

