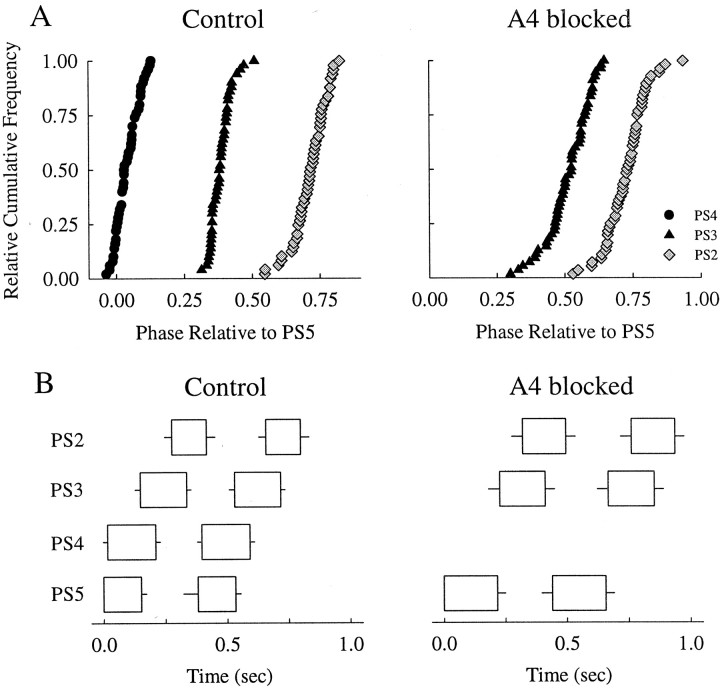
Fig. 4.
A, Relative cumulative-frequency plots of intersegmental phase before and during a blockade of synaptic transmission in A4. B, Box plots that show the mean + SD durations of PS bursts in A2, A3, A4, and A5 under control conditions and after A4 had been blocked for 1 hr. With A4 blocked, there were no PS4 bursts. The boxes have the same dimensions as those in Figure 3.

