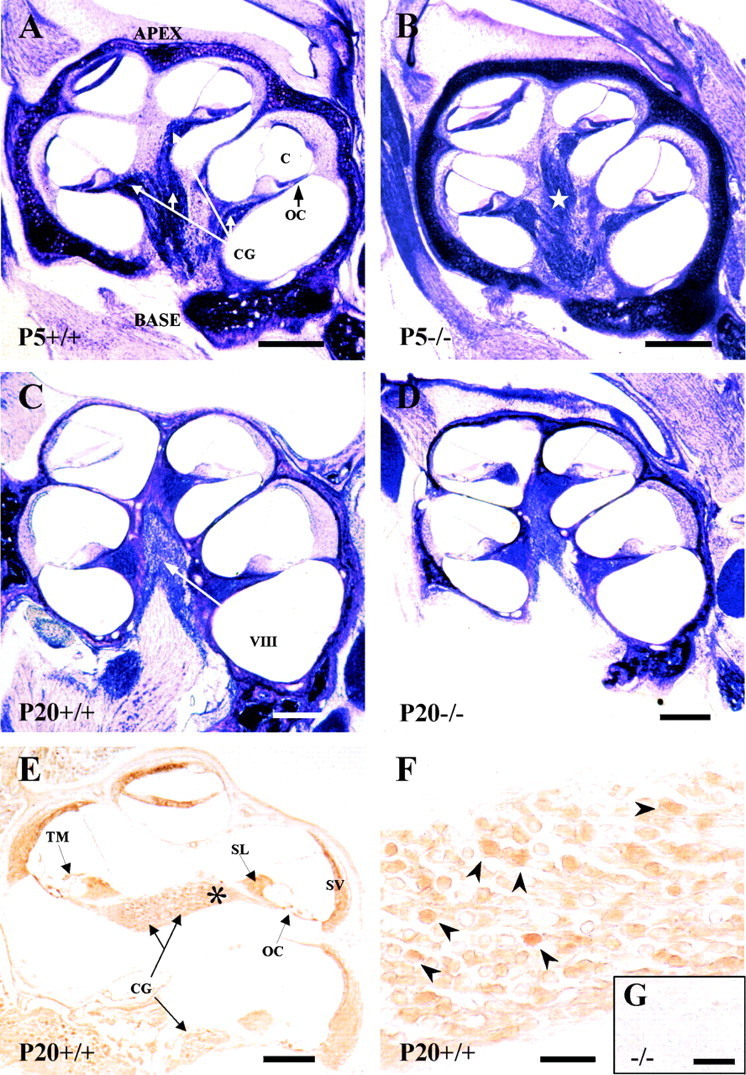
Fig. 1.

Cochlear anatomy of the mouse genotypes analyzed and IGF-1 expression. Nissl staining of mid-modiolar celloidin sections of the cochlea at P5 (A, B) or P20 (C, D) in Igf-1+/+ (A, C) and Igf-1−/− (B, D) mice. An increased thickness of the otic capsule cartilage and a dispersion of the fibers in the auditory branch of the eighth cranial nerve of Igf-1−/− at P5 (star) were observed in all animals studied. Note the reduction in size ofIgf-1−/− P20 cochlea compared with the Igf-1+/+ P20 controls. IGF-1 immunohistochemical expression in the cochlea (E) and cochlear ganglia (F) of P20Igf-1+/+ mice.Asterisk in E indicates the area shown inF; arrowheads in F point to the subpopulation of IGF-1-positive neurons. Theinset shows a magnification of the cochlear ganglion ofIgf-1−/− P20 animals (G). C, Cochlear duct;O, otic capsule; OC, organ of Corti;CG, cochlear ganglion; VIII, eighth cranial nerve; TM, tectorial membrane;SL, spiral limbus; SV, stria vascularis. Scale bars: A–D, 650 μm; E, 600 μm;F, 55 μm; G, 10 μm.
