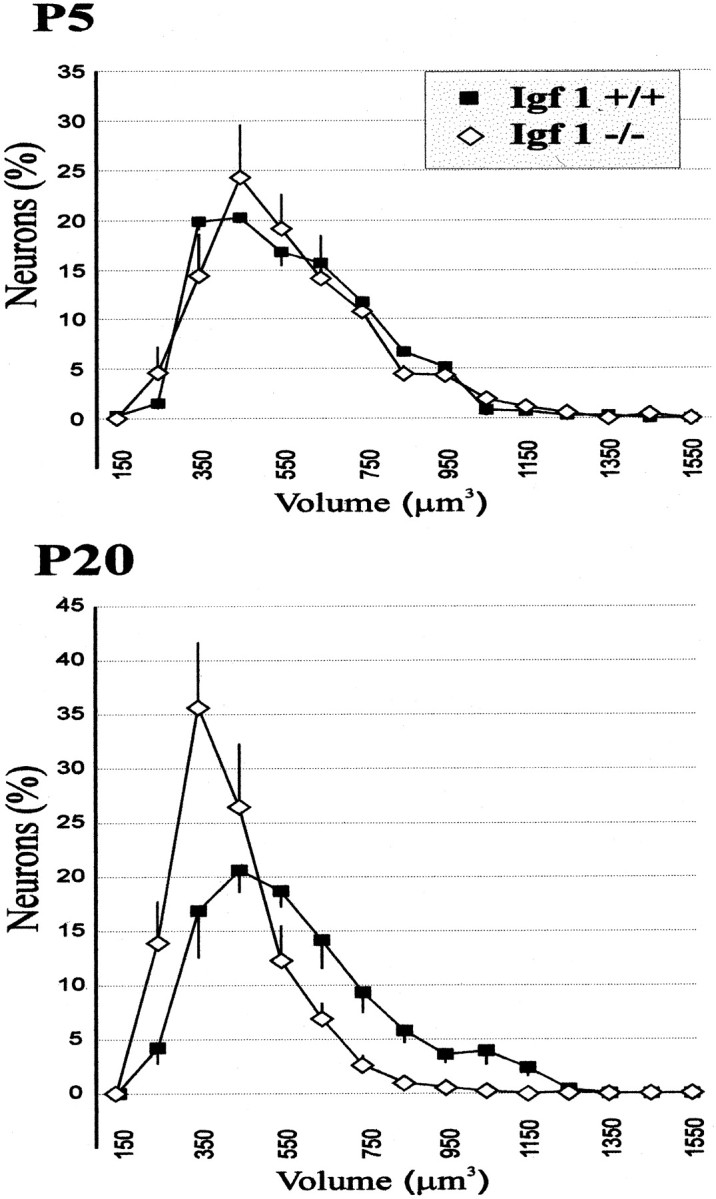
Fig. 4.

Different perikaryal volume distributions of cochlear ganglion neurons in Igf-1+/+ andIgf-1−/− mice. Linear plots of data obtained by application of stereological methods (see Materials and Methods) are represented for P5 (top) and P20 (bottom) mice. Error bars represent the SD among animals for each volume class. Whereas the distribution is monomodal in all cases, note the leftward displacement of the curve in the mutant mice at P20, with a marked decrease of cells in the largest size classes. See Table2 for statistical analysis.
