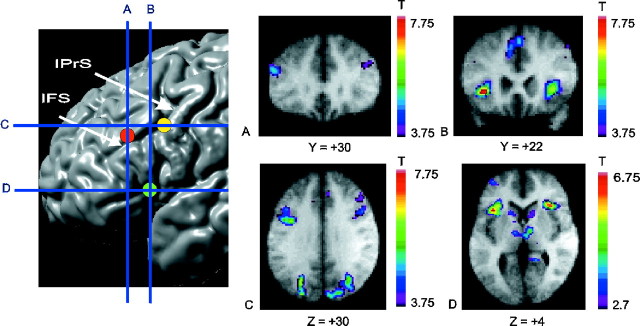
Fig. 2.
Location of prefrontal peaks. Thetopleft panel displays the sites of the main prefrontal areas identified in the experiment on a cortical surface rendering of an MRI in standard stereotaxic space. Thevertical blue lines indicate the anteroposterior level of the coronal sections in A and B. Thehorizontal blue lines indicate the dorsoventral level of the sections displayed in C and D. The focus in the mid-dorsolateral PFC is indicated by the red circle, in mid-ventrolateral PFC by the green circle, and in posterior PFC by the yellow circle. A, Coronal section through the mid-dorsolateral PFC peak at Y = +30 mm. B, Coronal section through the mid-ventrolateral PFC peak at Y = +22 mm.C, Horizontal section through the posterior PFC peak at Z = +30 mm. D, Horizontal section through the mid-ventrolateral PFC peak at Z = +4 mm. Note also caudate and thalamus activation. All activation peaks shown here occurred during receiving negative feedback (event 1) minus control feedback (event 5). Some of these PFC peaks also occur selectively in other subtractions, permitting their functional dissociation (see Discussion and Table 6). The anatomical MRI images shown inA–D are the average of the T1 acquisitions of the 11 subjects transformed into stereotaxic space. The color scale represents the T statistic. IFS, Inferior frontal sulcus; IPrS, inferior precentral sulcus.

