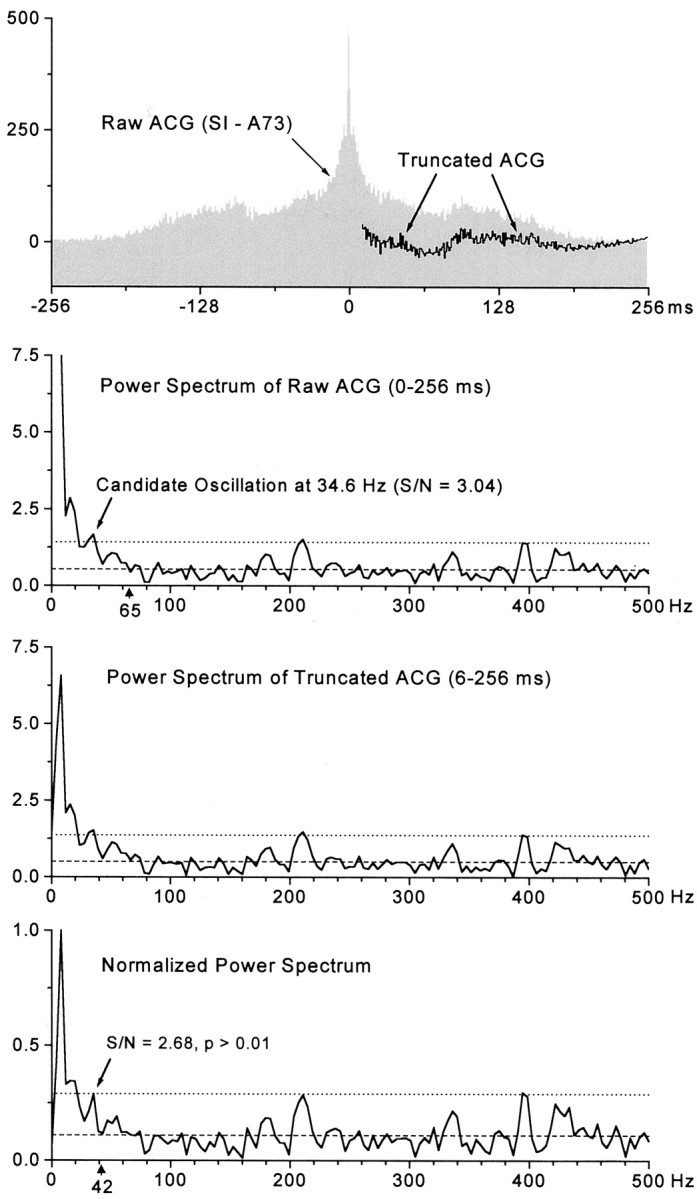
Fig. 1.

Method for detecting neuronal oscillations.Top panel, Raw and truncated ACGs for a spike train recorded in SI (A73). With the exception of the impulse peak at time 0, the same rhythmic patterns are present in both the raw and truncated ACGs. Second panel, Power spectrum of the raw ACG contains a large DC component that gradually merges into the gamma frequency range (20–80 Hz). Although power fluctuates randomly around the noise level (dashed line) at frequencies >65 Hz (arrowhead), a peak at 34.6 Hz exceeded the confidence limits (dotted line) and had a signal-to-noise ratio of 3.04. This small peak may have exceeded the confidence limits because it was superimposed on the trailing edge of an elevated low-frequency trend. Third panel, Power spectrum of the truncated ACG contained a much smaller DC component, but the low-frequency trend was still present. Bottom panel, The normalized power spectrum contained fluctuations around the noise level at frequencies as low as 42 Hz (arrowhead). After normalization, the small peak at 34.6 Hz failed to exceed the confidence limits, and its signal-to-noise ratio decreased to 2.68. Statistical analysis indicated that the distribution of values in the gamma frequency range of the normalized power spectrum was not significantly different from a Gaussian white noise distribution having the same mean value (KS test;p > 0.01).
