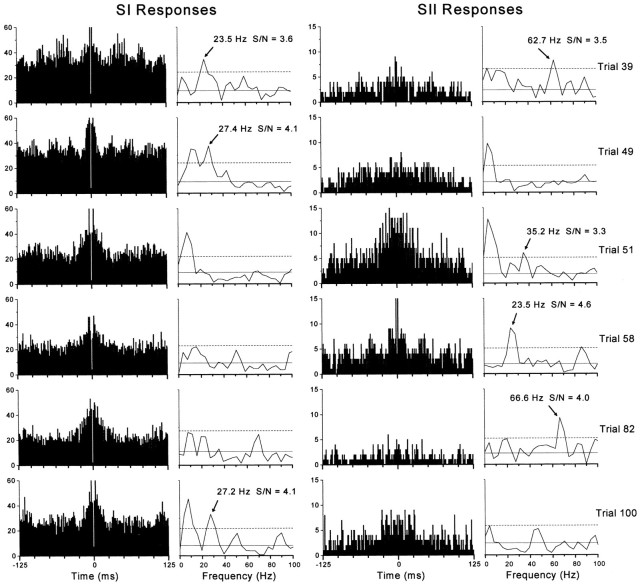
Fig. 10.
Trial-by-trial analysis of oscillatory responses in experiment A130. These trials illustrate the strongest oscillations (in terms of signal-to-noise ratio) that were detected among 100 trials, the summed multiunit responses of which are illustrated in Figure 4. The ACGs and power spectra represent the temporal structure of activity recorded simultaneously from SI (left) and SII (right) during specific trials as indicated.Arrows indicate peaks in the power spectra that represent significant oscillations in the gamma frequency range.Solid and dashed horizontal linesrepresent mean noise (from 250 to 500 Hz) or mean noise plus 3 SDs, respectively. Visual inspection of all 200 ACGs revealed gamma range oscillations in SI on trials 39 and 49, and in SII on trial 58.

