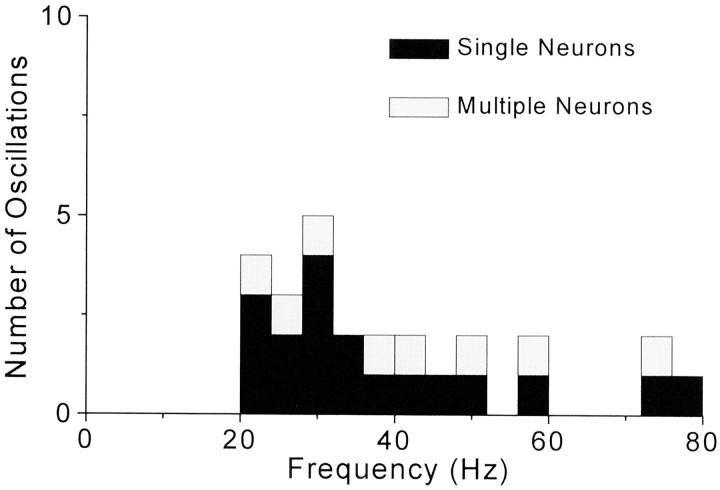
Fig. 7.
Distribution of neuronal oscillations according to frequency. Stimulus-induced neuronal responses that exhibited significant levels of oscillations in the gamma frequency range are represented according to their tallest peak in the power spectrum derived from the ACG. Bin widths appear as 4 Hz increments to correspond with the frequency resolution of the power spectra.

