
Fig. 3.
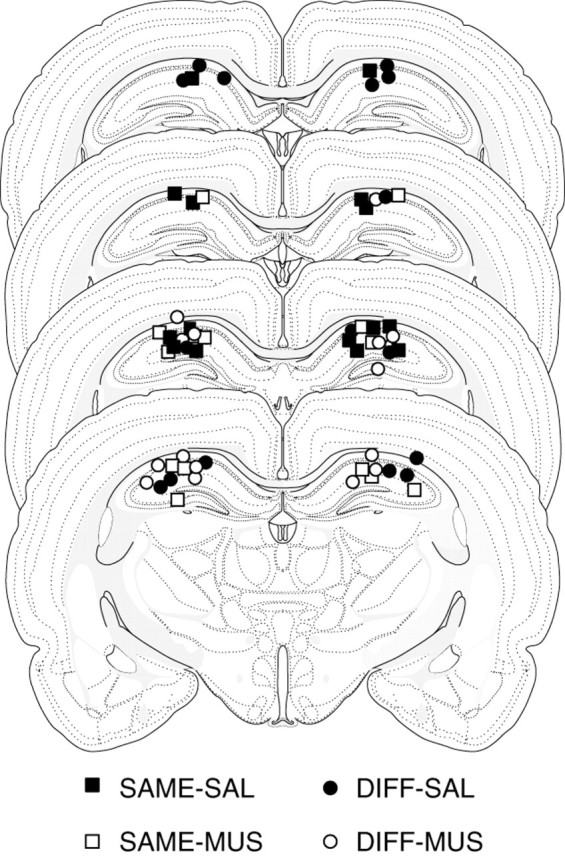
Illustration of injection cannula placements in the dorsal hippocampus (experiment 2). Placements represented are from all rats included in the final analysis (SAME-SAL, filled squares; SAME-MUS, open squares; DIFF-SAL,filled circles; DIFF-MUS, open circles). Atlas templates were adapted from Swanson (1992).