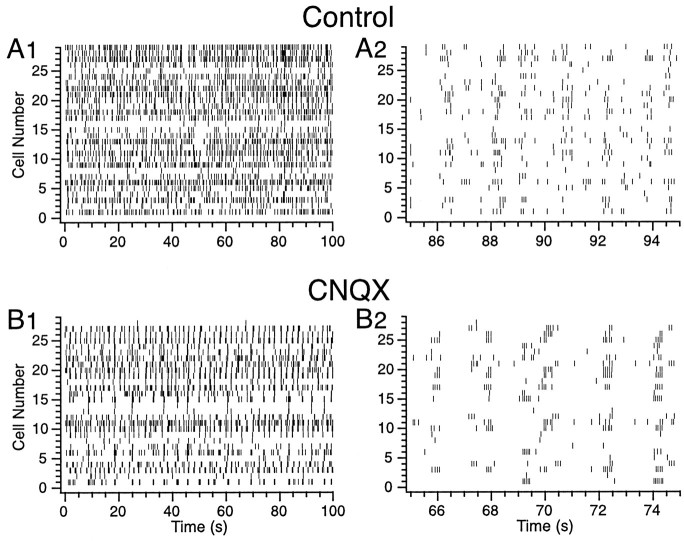
Fig. 3.
Raster displays of CS activity during control (A1, A2) and after intraolivary injection of CNQX (B1, B2). In this experiment, CS activity was recorded from 29 Purkinje cells simultaneously. Eachhorizontal row of tick marks represents the CS activity from a single Purkinje cell. Note the decrease in overall activity induced by the injection and the change in the pattern of activity (A vs B). The details of the shift in firing pattern induced by the CNQX injection are illustrated by rasters with an expanded time scale (A2,B2).

