
Fig. 4.
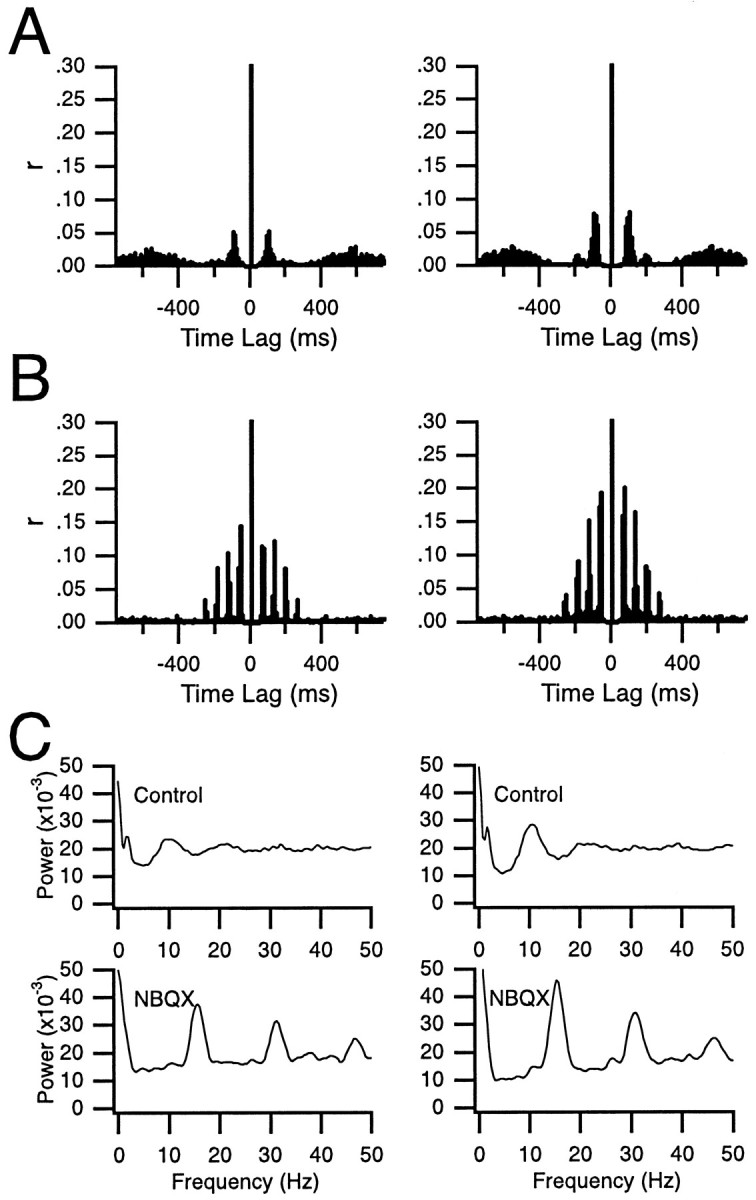
Increase in CS rhythmicity after intraolivary NBQX injection. A, B, Normalized autocorrelograms of the CS activity recorded from two Purkinje cells during a 20 min control period (A) and during a 20 min period after block of glutamatergic input to the inferior olive by NBQX (B). The centralpeaks are truncated in A andB. C, FFTs of the autocorrelograms shown in A (top) and B(bottom) illustrating the shift in oscillation frequency from 10 Hz in control to 15 Hz after injection of NBQX. Eachcolumn shows histograms and FFTs from one cell.