Fig. 7.
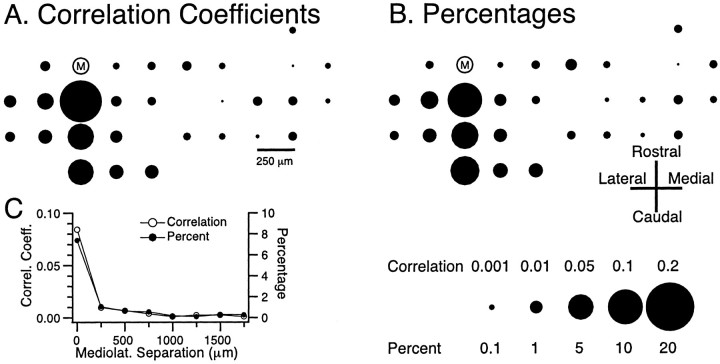
Spatial organization of CS synchrony.A, B, Spatial distribution of CS synchrony with regard to reference cell M, as measured by cross-correlation coefficients (A) and by the percentage of synchronous spikes of cell M with each of the other simultaneously recorded cells (B). In each case (correlation coefficients, percentages) the positions of thecircles represent the relative positions of the recording electrodes on crus 2a. The area of each circleis proportional to the degree of synchrony between cell M and the cell located at that position. Scale at bottom right of figure gives calibration for both measures. C, The average level of synchronization between cell M and other cells plotted as a function of the mediolateral separation between the cells. Bin size equaled 1 msec for all analyses, and session duration was 20 min.Correl. Coeff., Correlation coefficient;Mediolat., mediolateral.

