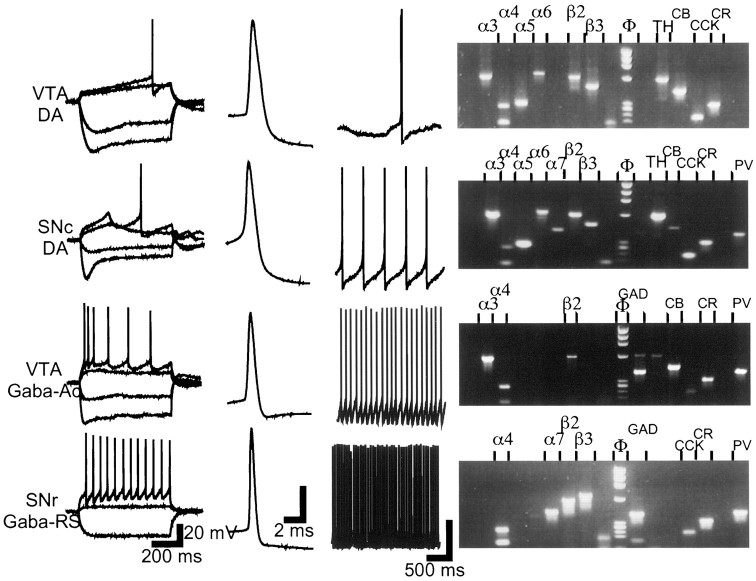
Fig. 1.
Electrophysiological and molecular profile of VTA and SN neurons. Electrophysiological classes were distinguished on the basis of intrinsic membrane potential and firing properties in response to current steps applied from −64 mV (first panel from left); on action potential waveform and duration, measured at rheobase current (second panel); and on firing frequency at the resting membrane potential for neurons that were spontaneously active (third panel). DA neurons in the SNc and SNr were indistinguishable; they exhibited strong Ihactivation and slow potential oscillations in the subthreshold range. DA neurons in the VTA showed a less pronouncedIh activation and a slow ramp potential before firing initiation. Gaba-Ac neurons in the VTA were characterized by marked spike-frequency accommodation in response to depolarizing current steps. Gaba-RS neurons in the SNr fired with a regular discharge pattern, at all amplitudes of depolarizing current steps and from depolarized as well as hyperpolarized holding potentials. Vertical calibration bar is 20 mV in all three panels. The right panel shows agarose gels of the PCR amplification products corresponding to the illustrated neuron. Only detected products are labeled (left to right): nicotinic subunits α2–7 and β2–4, marker, GAD (GAD 65 and GAD 67), TH, CB, CCK, CR, NT, and PV. The gel for the GABA-Ac neuron (third from top) shows a faint TH band; such (rare) TH bands were discounted. When GAD and TH were coexpressed (see Results) both bands were of equal intensity.

