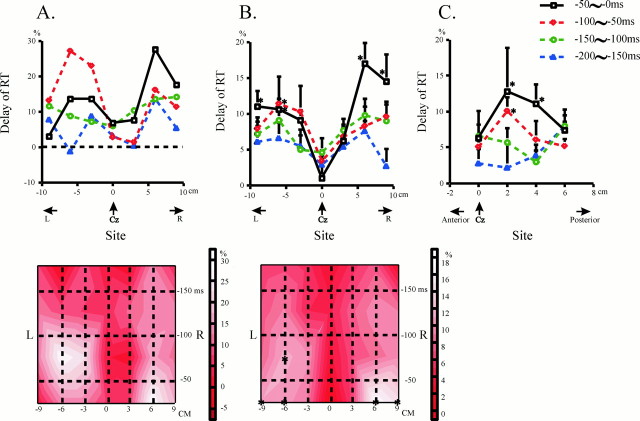
Fig. 3.
The effect of TMS over the motor strip (A, B) and midline region (C) in relation to the site of TMS (experiment 2). A, In one subject, the delay of RT was plotted as a function of the site where focal TMS was delivered over the motor strip. The right side of the figure (positive values on the abscissa) corresponds to the right of the head, and the left side (negative values on the abscissa) to the left. The four curves in the top figure each depict the delay when TMS was applied 0–50, 50–100, 100–150, and 150–200 msec before EOVt. In this and the following figures, the delay is expressed as its percentage to the control reaction time in the same session. As shown above, the delay increased as TMS was applied at a later time interval. The most prominent delay was induced over points 6 cm to the right and left of Cz (right and left motor areas). The delay was greater over the left motor area than over the right motor area 50–100 msec before EOVt, whereas the latter was greater than the former 0–50 msec before EOVt. The accompanying diagram beneath shows the same data as a contour plot in the spatiotemporal domain. The abscissa shows scalp regions over the motor strip, ranging from 9 cm to the left and to the right of Cz (left and right motor areas), and the ordinate gives the time when TMS was delivered. As shown in the bars on the right, regions in lighter tints depict the regions where the delay induced by TMS was large, whereas those with darker tints correspond to regions where the effect of TMS was small. Note again that the delay induced by TMS was most prominent over the left and right motor areas and that the “activity” of the left motor area preceded that of the right motor area. B, A similar trend was noted in all the subjects. These plots were constructed for the delays averaged across all the subjects. Conventions as in A, except that error bars give the SEs, and asterisks indicate significant delay compared with control RT in the same session (paired t test,p < 0.05). Here again, the delay increased with time and was maximal over the left and right motor areas. Note also that mild left hemispheric predominance 50–100 msec before EOVt switched over to robust right hemispheric predominance 0–50 msec before EOVt. The bottom figure illustrates the same data as a plot in the spatiotemporal domain. C, A similar plot when the magnetic coil was placed over the midline region, 0, 2, 4, and 6 cm anterior to Cz. This graph also plots the delays averaged across all the subjects. Error bars indicate SEs.Asterisks indicate significant delay compared with control reaction times (paired t test,p < 0.05). Significant delay was noted over points 2–4 cm anterior to Cz at time intervals of 0–50 and 50–100 msec before EOVt.

