
Fig. 3.
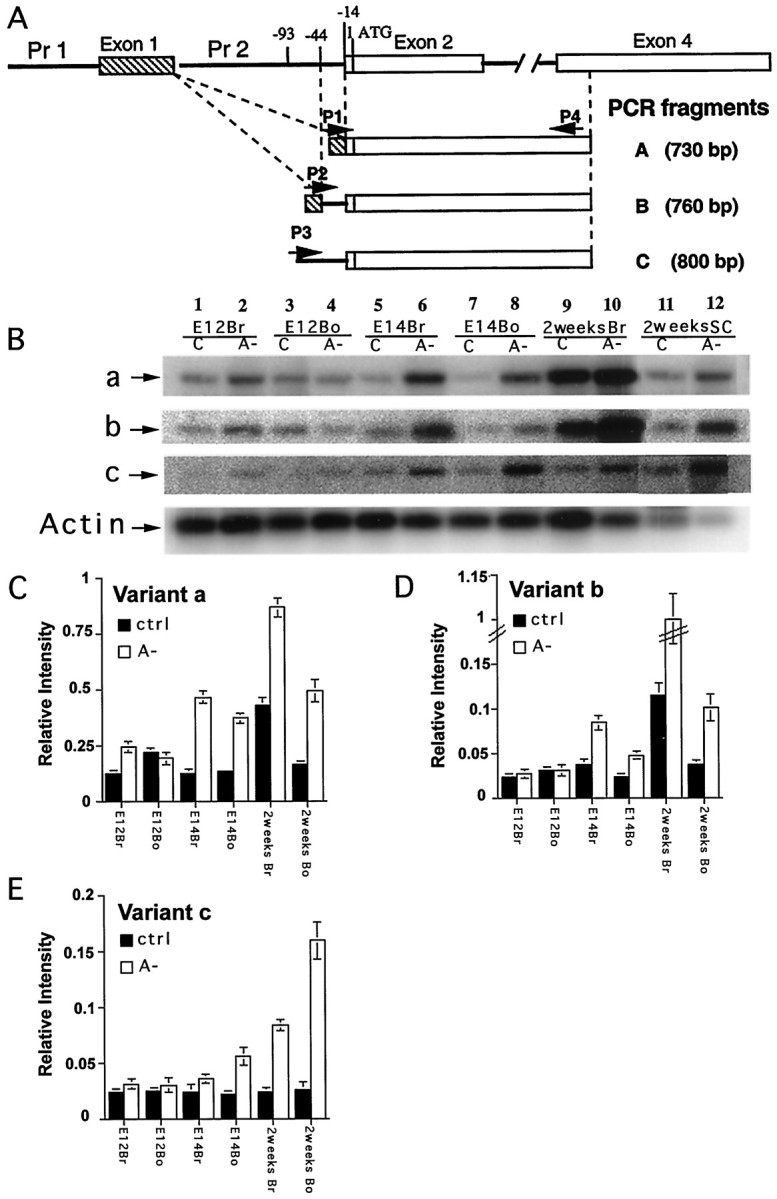
Upregulation of KOR mRNA in A− animals and embryos. A, The positions of primers (P1– P4) used to amplify KOR isoform mRNA and the sizes of the expected PCR products. P1spans the specific splicing junction of exons 1/2 of Variant A. P2 spans the specific splicing junction of exons 1/2 ofVariant B. P3 is specific for Variant C. P4 is the antisense primer in exon 4, which is common to all three variants.B, Embryos at E12 and E14 were obtained from control mothers (C) or A− mothers and were dissected into brain (Br) and body (Bo) for RNA isolation. Postnatal animals at 2 weeks old were killed, and brain and spinal cord (SC) were dissected out for RNA isolation. RT-PCR was conducted as described in Materials and Methods for the analyses of three KOR mRNA isoforms, a, b, and c. Internal control, actin, was included in each reaction. C, Statistical analyses of isoform a expression in control (ctrl) and A− animals during development. Three independent RT-PCR experiments were conducted to examine three animals, and the data were quantified by PhosphorImager analyses. The level of KOR isoform a expression was determined by normalizing KOR isoform a level to actin message level. D, Statistical analyses of KOR isoform b expression in control and A− animals during development.E, Statistical analyses of KOR isoform c expression in control and A− animals during development.