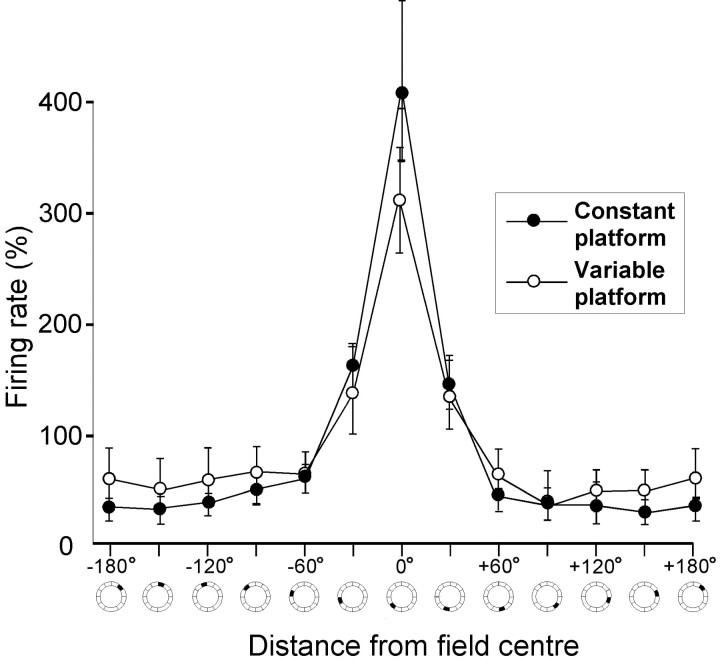
Fig. 5.
Similar shape of hippocampal place fields after training with a constant or a variable platform location. The diagram shows unidirectional median firing rates (Hodges–Lehmann estimates ± upper and lower 95% Tukey–Wilcoxon confidence intervals) as a function of distance from the segment in which the cell fired at the highest rate (0°). Segments cover 30° of arc each.

