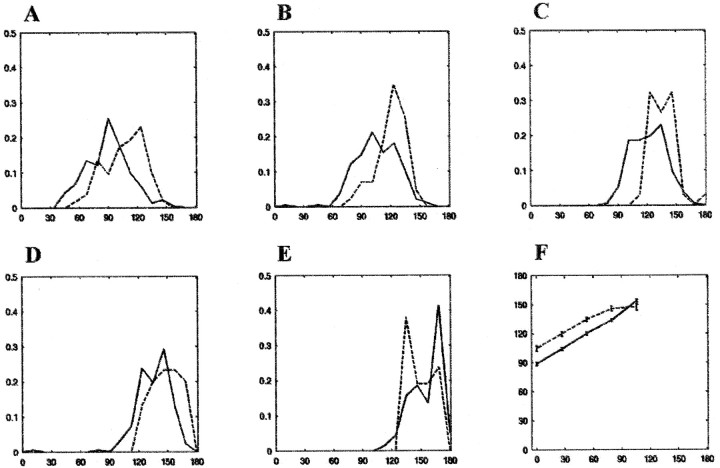
Fig. 7.
Distribution of transition points in the dark and light. The transition from the box reference frame to the laboratory reference frame was determined using a procedure (Redish et al., 2000; see Materials and Methods) in which the tightness of the place field distribution in the two reference frames was computed at each moment in time. The transition was taken as the point where the difference between the two measures crossed zero. A–E, Histograms of transition points in the light (solid lines) and dark (dotted lines) for box 1 out–box 5 out journeys, respectively. The x-axis represents the track (in centimeters), and the y-axis represents normalized counts. F shows the location of the mean transition points on the track. The x-axis corresponds to the origin of a journey on the track, and they-axis represents the location of the mean transition points (± SEM) in the light (solid lines) and dark (dotted lines) conditions for each of the five journey types. Box location and transition point are related linearly, with the exception of the transition points for the box 5 out journeys in the dark, for which the transition occurred earlier than expected on the basis of the first four journey types.

