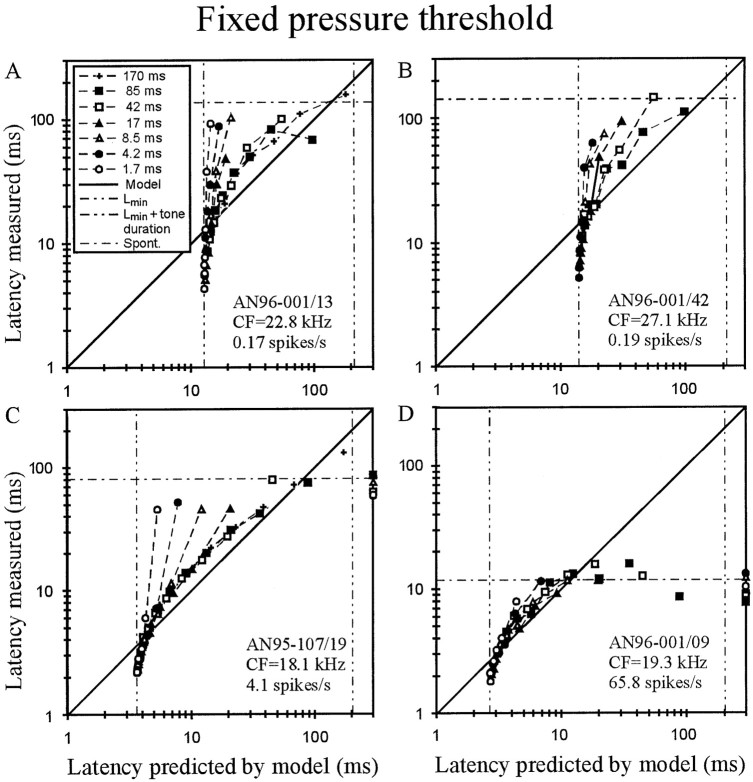
Fig. 2.
Evaluation of the fixed pressure threshold model. A–D, For four high-CF AN fibers of different spontaneous discharge rates (seeinsets), the mean first-spike latency measured is plotted against the best fit of the model, with threshold pressurePthr (in Pascal) and transmission delayLmin (in milliseconds) as the two free parameters. Data obtained with tones of different SPLs but of the same rise time (see key in A) are interconnected. Unconnected symbols represent data points that were excluded from the fits, because measured latencies were close to, or even longer than, spontaneous latency (horizontal dotted-dashed lines) and hence largely caused by spontaneous activity. Latencies unexplained by the model, i.e., when first spikes were triggered during the plateau phase of the stimulus, are plotted at the extreme right (see C, D).Left and right vertical dashed-dotted lines represent Lmin and tone duration plus Lmin, respectively. Note the systematic deviations of the data from the model.

