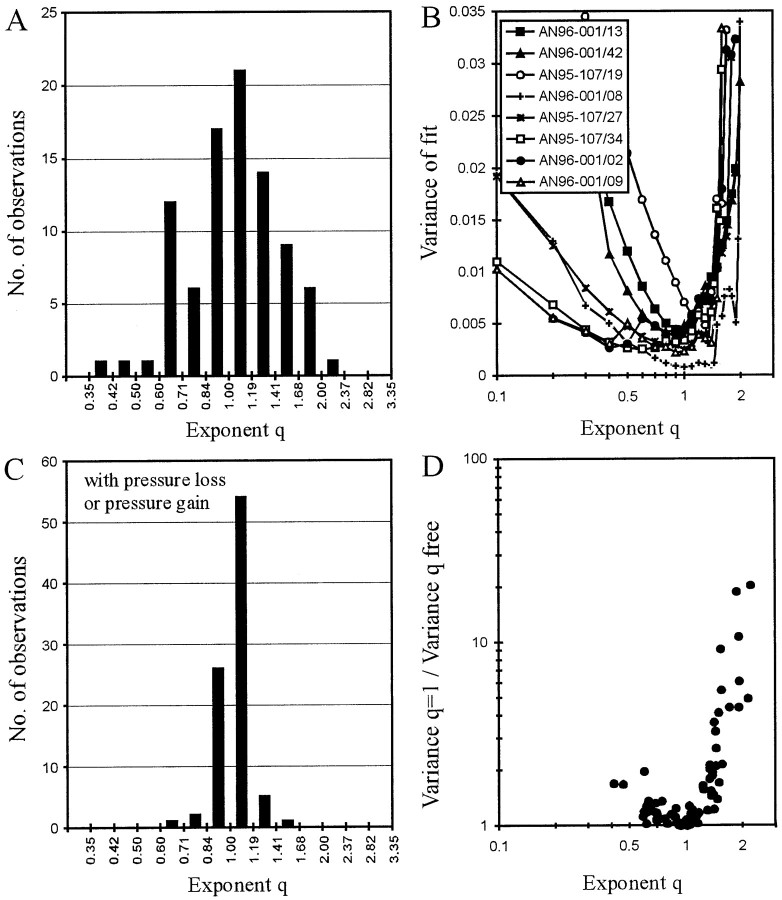
Fig. 4.
Evaluation of the integration threshold model. A, Distribution of the exponent qobtained from fits of Equation 3. Note that the 89 values are distributed around 1, and not 2, suggesting a pressure integration threshold rather than an intensity integration or energy threshold.B, Plots of the variance of the fits of Equation 3 for exponents q fixed at values between 0.1 and ∼2 (ordinate) for eight selected AN fibers. Note that the minima are generally well defined and are near 1, although additional local minima can be found below and above 1. C, Distribution of the exponent q obtained from fits of Equation 3, but including the pressure loss or gain,Pc, fixed at the value obtained from fits of Equation 4. Note that the exponent q is very narrowly distributed around 1 (compare A). Hence, a pressure integration threshold model with leakage/additional inflow can explain the first-spike timing of all AN fibers. D, Ratio of variances obtained from fits of Equation 3 withq = 1, i.e., with a fixed pressure integration threshold, and with q as a free parameter plotted against q. Note that the variance ratio increases steeply with increasing q for q > 1.

