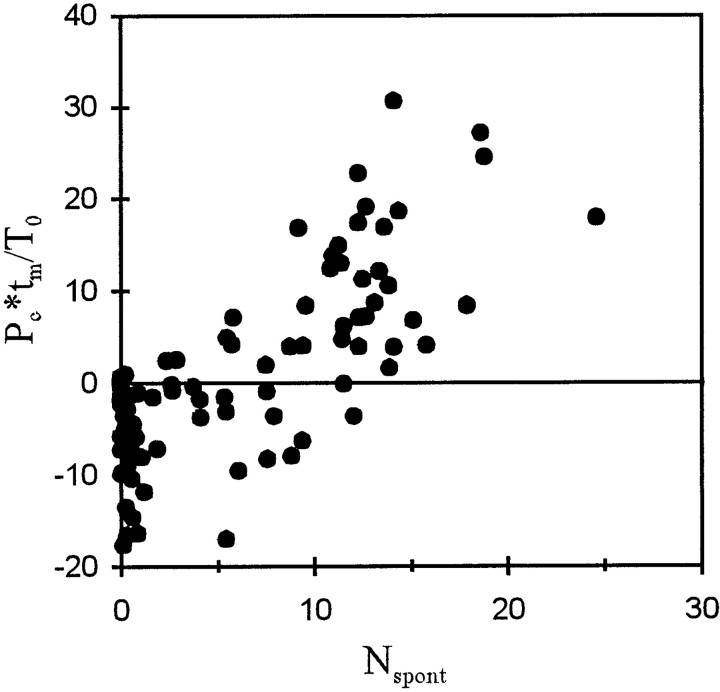
Fig. 9.
Scatterplot of the number of times the pressure integration threshold of a fiber, T0, is reached by integration of the pressure gain/pressure loss,Pc, during a 210 msec interval,tm, (Pc ×tm/T0) against the average number of spikes,Nspont, measured in such an interval in the absence of intentional acoustic stimulation. Note the close correlation with a slope near 1 (for further explanations, see Results).

