
Fig. 1.
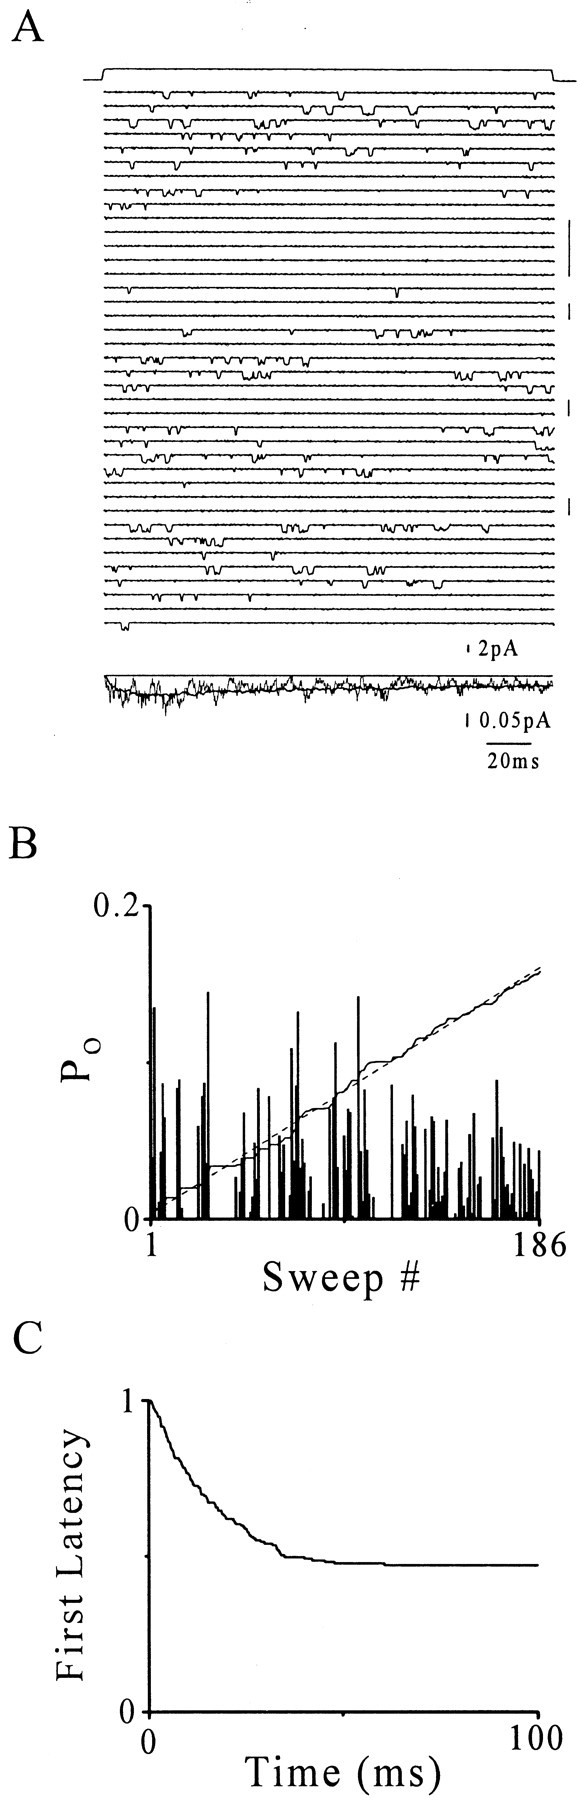
Single-channel activity from a rapidly perfused, outside-out membrane patch from a cell expressing α1β1γ2 GABARs.A, Top, Liquid junction potential response (see Materials and Methods) representing the time course of the GABA pulse (upward deflection, 30 μm; 200 msec) that was delivered every 15 sec. Middle, Consecutive sweep voltage-clamp current records show single-channel activity triggered by GABA pulses. Downward current deflections mark openings of a single α1β1γ2 GABAR with a primary conductance state of 29 pS (holding potential = −70 mV). Vertical bars mark periods of apparent null clustering. Bottom, Ensemble current average (irregular line) and superimposed representative normalized macropatch current collected under the same conditions (heavy line). The vertical scale bars reflect single-channel amplitudes. B, Sweep open probability (Po) plotted versus sweep number (see Materials and Methods). Integral of Po(irregular line, arbitrarily scaled) over sweep number is shown. An appropriately scaled linear function (dashed line) overlies the integral of Podemonstrating quasi-linearity, which indicates that channel activity is stationary over the data collection period (see Results).C, First latencies given as a complement of the distribution.