Fig. 1.
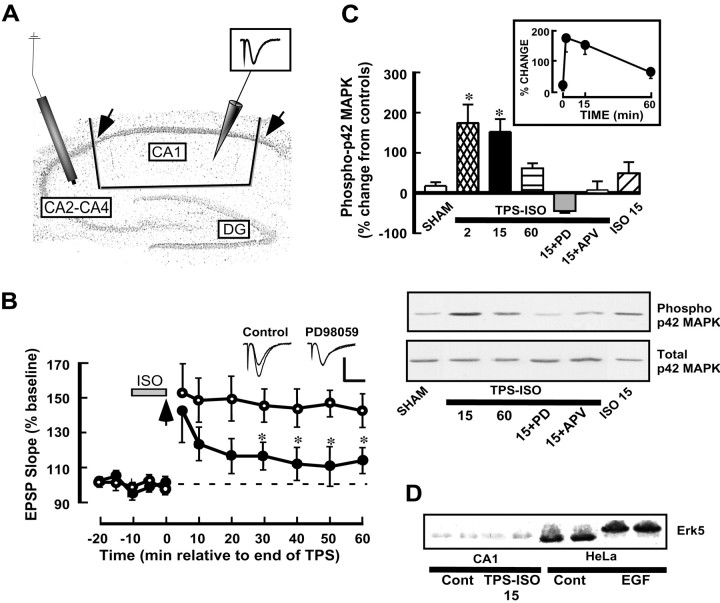
MAPK participates in TPS–ISO-induced LTP. A, Nissl-stained unstimulated hippocampal slice showing the positioning of the stimulating (left) and recording (right) electrodes and the cuts used to excise the CA1 region. Thearrows indicate the boundaries of the CA1 region, for the purpose of counting cell bodies. B, MAPK activity is required for LTP induced by TPS–ISO. Isoproterenol (1 μm) was applied to the bath for 10 min, followed by theta pulse stimulation of the Schaffer collaterals (TPS; 150 pulses at 10 Hz). TPS–ISO-induced LTP persisted for at least 60 min after the end of stimulation (○; n = 5). In slices preincubated with PD98059 (50 μm), the maintenance of TPS–ISO LTP was blocked (●; n = 6).Asterisks indicate group differences with p < 0.05 (Newman–Keuls multiple comparison test). The superimposed traces show representative field EPSPs before TPS–ISO and 60 min after stimulation. Additional experiments showed a similar inhibition of LTP by pretreatment with 30 μm PD98059 [LTP at 60 min: 142 ± 27 in controls (n = 3) and 117 ± 13 in treated slices (n = 3); p< 0.05], in contrast to the previous findings with HFS-induced LTP (Liu et al., 1999). Calibration: 0.5 mV, 5 msec. C, TPS–ISO increases p42 MAPK phosphorylation in area CA1 of the hippocampus. The bar graph summarizes immunoblot data and shows the levels of phospho-(Thr202/Tyr204)-p42 MAPK normalized to total MAPK in each CA1 region and expressed as percentage of paired, untreated control slices. 2, 15, and60 indicate minutes after stimulation. Significant differences from sham-stimulated slices are indicated by theasterisks (p < 0.05). PD98059 (PD) was applied at 50 μm in the maintenance chamber, and aminophosphonovaleric acid (APV) was applied in the recording chamber at 100 μm for 10 min before stimulation). ISOindicates slices exposed to 1 μm isoproterenol alone for 10 min. The inset shows the time course of MAPK phosphorylation after TPS–ISO stimulation. An immunoblot, from a single experiment, of phospho-p42 MAPK (top panel) and total-p42 MAPK (bottom panel) is shown below. D, TPS–ISO does not phosphorylate Erk5. The immunoblot, probed for Erk5 immunoreactivity, was run with homogenates from hippocampal area CA1 (4 lanes on the left) and HeLa cells (4 lanes on the right). Within each type of tissue, the two lanes on the left are from untreated controls, whereas the two lanes on theright are from stimulated tissue (TPS–ISO, 15 min after stimulation for CA1 and 15 min of 1 ng/ml EGF for HeLa cells). Erk5 from EGF-stimulated HeLa cells shows a clear mobility shift, indicative of increased phosphorylation, but no shift occurred in stimulated hippocampus.

