Fig. 2.
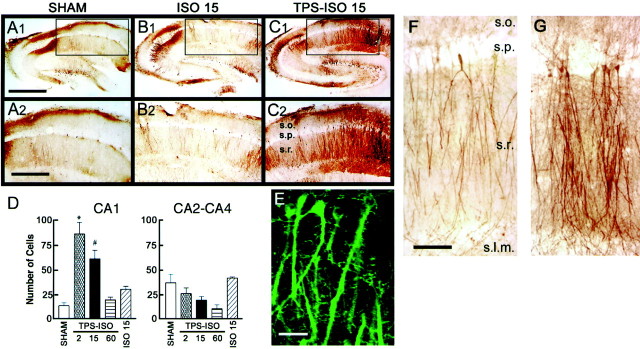
The hippocampal distribution of phosphorylated MAPK after TPS–ISO. A–C, Phospho-MAPK was visualized using DAB staining. The top images show entire hippocampal slices, with the boxed region (areaCA1) digitally expanded in the bottom images. A shows a sham-treated slice,B shows a slice treated with 1 μmisoproterenol alone and harvested 15 min after treatment, andC shows a TPS–ISO slice 15 min after treatment. Note the prominent staining in stratum pyramidale (s.p.) and stratum radiatum (s.r.) of CA1, which was consistently seen in TPS–ISO-treated slices. In this slice, stratum oriens (s.o.) also showed strong staining, which was observed only in a minority of slices treated with TPS–ISO. Scale bars:top traces, 1 mm; bottom traces, 500 μm. D, Summary of the quantitative analysis performed on DAB-positive pyramidal cell bodies in areas CA1 (left panel) and CA2–CA4 (right panel). DAB-positive cell bodies were counted for CA1 (roughly corresponding to the bottom panels ofA–C) (Fig. 1A) and for the remainder of the pyramidal layer (CA2–CA4). In area CA1, only TPS–ISO-treated slices, harvested at either 2 or 15 min after stimulation, showed an increase in DAB-positive cells (*p < 0.01; #p < 0.05). No significant effects were observed in CA2–CA4.E, A laser confocal immunofluorescent image of phospho-MAPK immunoreactivity in area CA1 of a TPS–ISO-treated slice harvested 15 min after treatment. Labeling was observed throughout the dendrites of stratum radiatum, in the perinuclear region, and in the nucleus. Scale bar, 25 μm. F, G, DAB-labeled images within area CA1 of sham-stimulated (F) and TPS–ISO (G) slices, harvested 15 min after stimulation. The entire apical dendritic tree of CA1 pyramidal neurons is shown. s.o., Stratum oriens; s.p., stratum pyramidale; s.r., stratum radiatum; s.l.m., stratum lacunosum-moleculare. Scale bar, 100 μm.

