
Fig. 11.
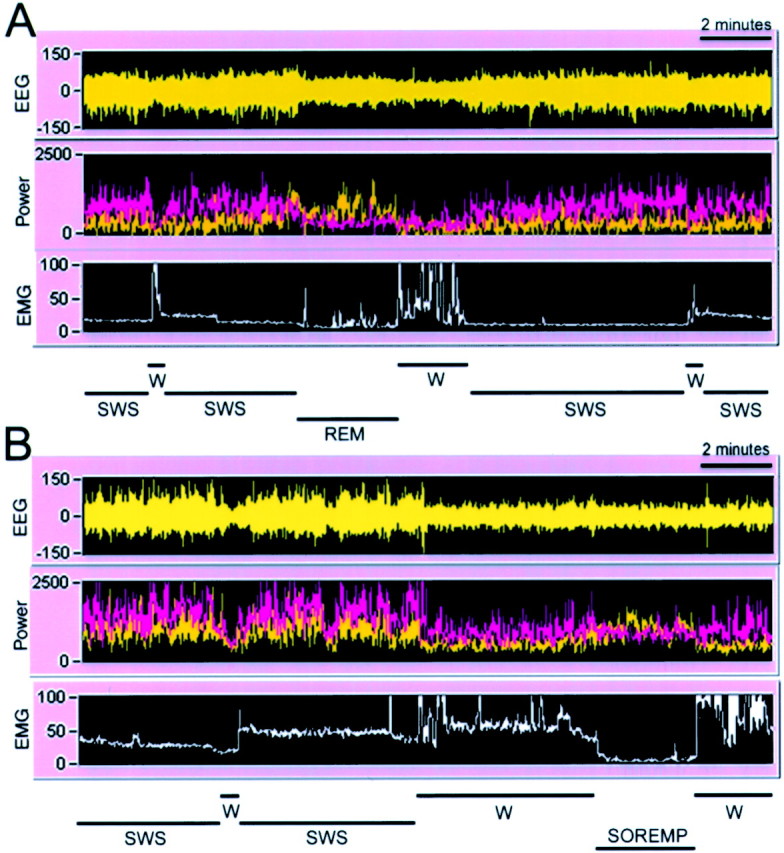
Alternation between wakefulness (W), SWS, and REM sleep in rats administered saline (A) or Hcrt2-SAP (B) into the LH. The figure represents a 20 min segment of a sleep–wake recording during the night (9:00 P.M.).A and B consist of a recording of the EEG, power of the EEG in the δ (0.3–4 Hz; pink) and θ (4–12 Hz; yellow) bands, and integrated activity of the nuchal muscles (EMG). The sleep–wake state determination, based on the relationship of the EEG, power, and EMG activity, is indicated at the bottom of each panel.A depicts a normal transition from SWS to REM sleep to wakefulness. B depicts a SOREMP exhibited by a Hcrt2-SAP-treated rat with a 90% loss of Hcrt-ir neurons. The SOREMP is identified by a loss of EMG tone (near zero), by increased θ activity, by a reduction in δ activity (pink band in B), and by an EEG amplitude that is similar to wakefulness. These criteria are used to identify REM sleep, including SOREMP, and they are not present during wakefulness or SWS. Note that the first brief bout of wakefulness in Bcannot be construed as REM sleep, because there is no θ activity and the EMG tone is rising, denoting that the rat woke up, albeit briefly.