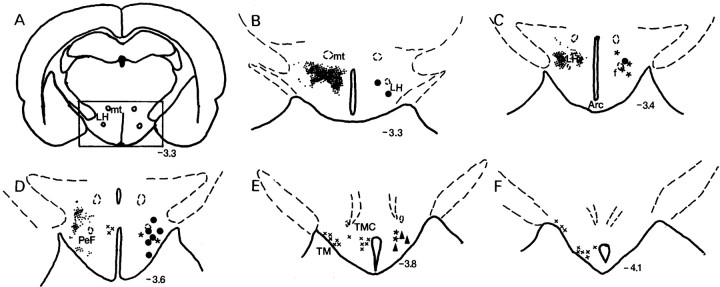
Fig. 6.
Camera lucida drawings of injection sites as well as Hcrt-ir neurons (small dots) in the LH.Large filled circles represent the sites for which application of Hcrt2-SAP produced >60% Hcrt cell loss (Hcrt-x rats).Filled triangles represent the sites for which Hcrt2-SAP injections produced <30% Hcrt cell loss. Asterisksrepresent the saline injection sites. The location of Hcrt neurons (small dots) and ADA-ir neurons (marked by ×) is shown on the left side of the drawings.Arc, Arcuate nucleus; f, fornix;mt, mammillothalamic tract; PeF, perifornical area; TM, tuberomammillary nucleus; TMC, TM central portion. The nomenclature is according to the rat atlas of Paxinos and Watson (1986).

