Fig. 1.

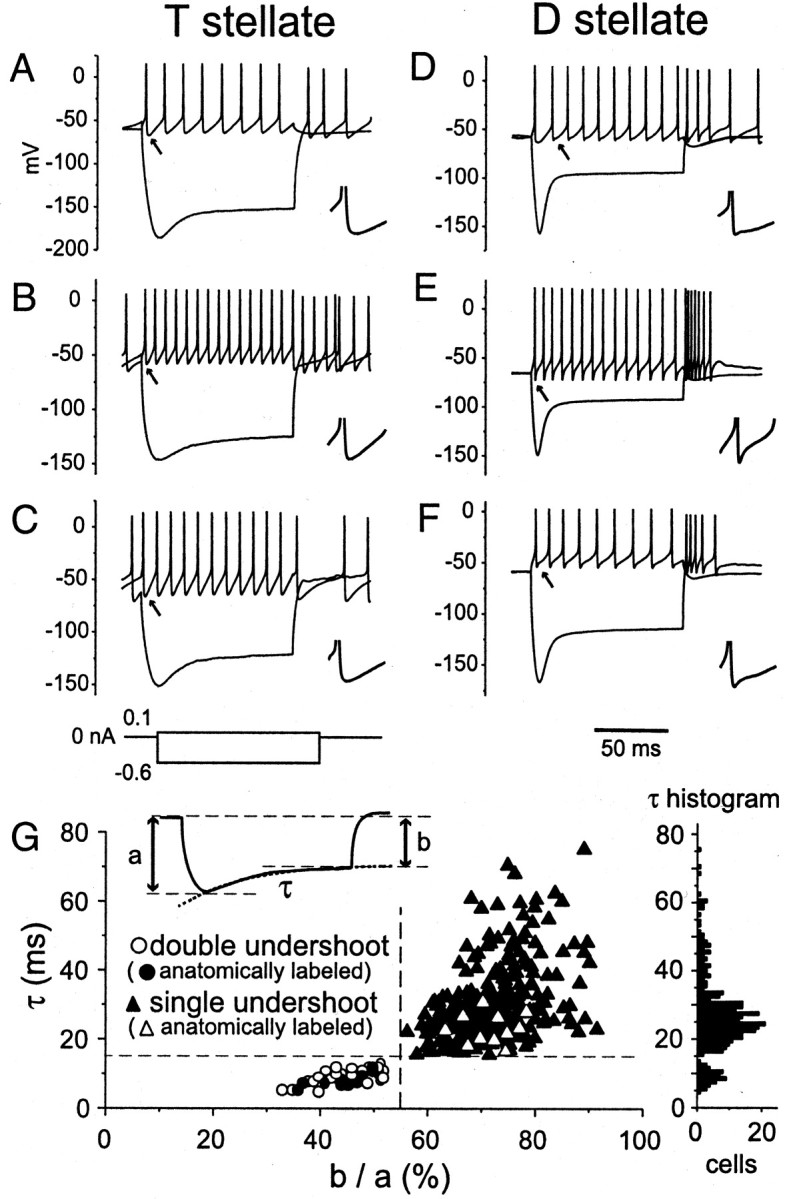
Identification of T and D stellate cells.A–C, Voltage responses to depolarizing and hyperpolarizing current pulses in three representative T stellate cells. Action potentials were followed by single undershoots. The response to hyperpolarizing current shows weak inward rectification.D–F, Voltage responses to similar current pulses in three representative D stellate cells. In most cells, action potentials were followed by obviously biphasic undershoots. Hyperpolarizing responses show prominent inward rectification. Insets, Expanded traces of the undershoots indicated by arrows(time scale: the full length of the traces corresponds to 8 msec for all insets). Experiments were done using normal external and internal solutions. G, Correlation of features shows that T and D stellate cells form distinct populations of neurons. Left inset, Measurements were made of peak hyperpolarization (a) and steady-state hyperpolarization (b), and the sags were fit with a single exponential with time constant (τ). Open circles, Cells with biphasic undershoots; filled triangles, cells with action potentials whose undershoots are monophasic. The plot shows that cells with rapid sags toward rest (short τ) had deeper sags (small b/a) and had undershoots with two components. The plot is based on responses to 0.6 nA hyperpolarizing current pulses in 296 cells whose responses fall into the top right cluster and are identified as T stellate cells and 44 whose responses fall into the bottom left cluster and are identified as D stellate cells. Anatomically labeled cells are plotted with filled circles andopen triangles, respectively. The dashed lines that separate the two groups lie at 55%b/a and 15 msec τ. Right, Histogram of distribution of τ for all cells. The sampling interval was 1 msec.
