
Fig. 2.
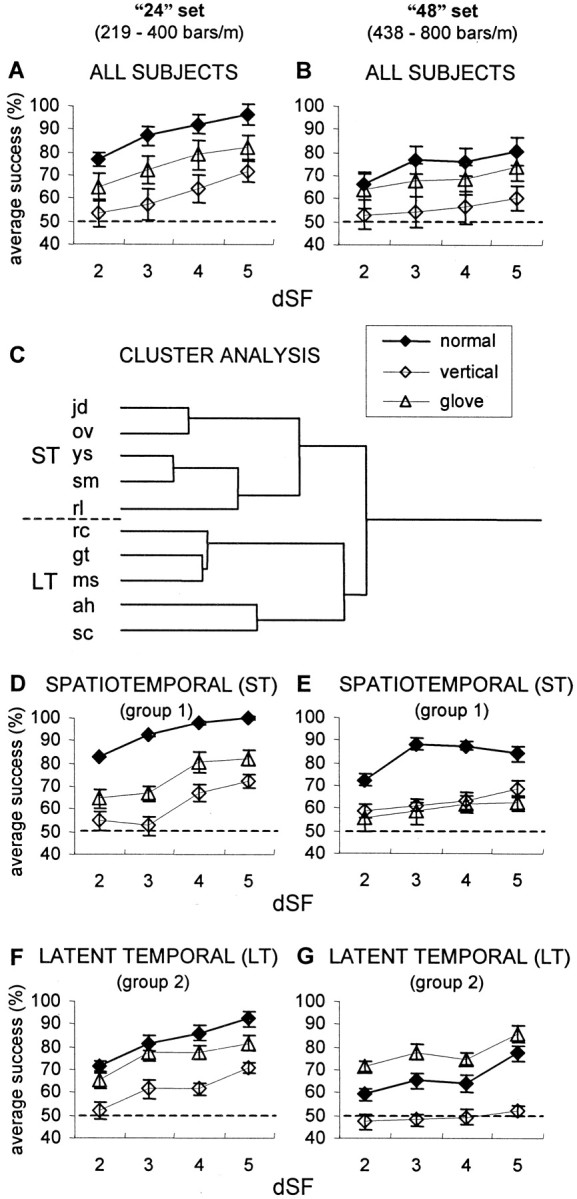
Effect of scanning type on average psychometric curves. A, Average performance of the initial 10 subjects on the 24 low-amplitude sets of gratings. For each subject, the success rate was the percentage of successful trials of the total number of trials. dSF is the difference, in log units, between the SFs presented to the two hands. Error bars indicate SEM.Dashed line represents chance level. B,Average performance of the initial 10 subjects on the 48 low-amplitude sets of gratings. C, Pearson complete cluster analysis of data in A and B (see Results). Group 1 (ST), subjects jd, ov,ys, sm, and rl; group 2 (LT), subjects rc, gt,ms, ah, and sc. The lengths of the branches represent the distances Dij between the subjects: Dij = 1 −Pij, wherePij is the Pearson product moment correlation between subjects i and j.D–G, Psychometric curves of ST group (n = 5) with 24 (D) and 48 (E) sets of gratings, and LT group (n = 5) with 24 (F) and 48 (G) sets of gratings. Results were averaged for each group.