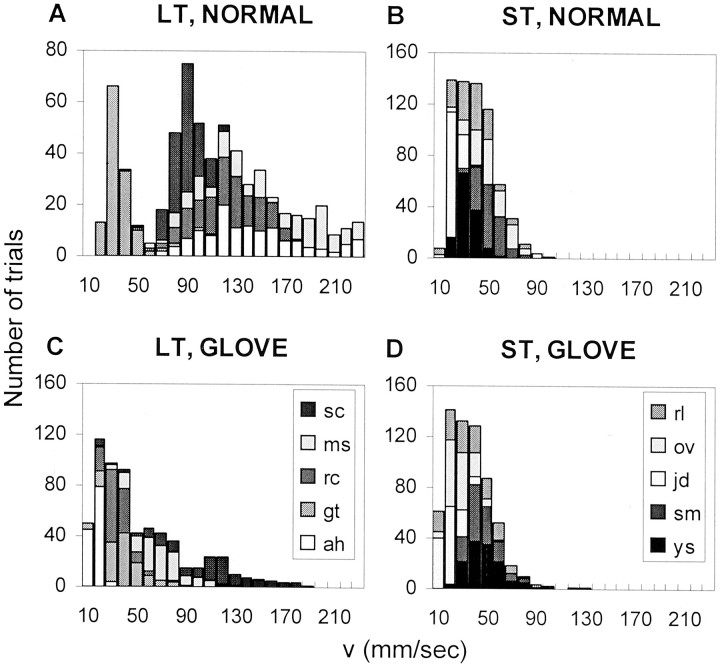
Fig. 4.
Distribution of the trial velocities(V) of the left hand during the scanning of the 48 low-amplitude sets of gratings. Each gray levelrepresents a different subject. A, LT subjects and normal scanning. B, ST subjects and normal scanning.C, LT subjects and glove scanning. D, ST subjects and glove scanning.

