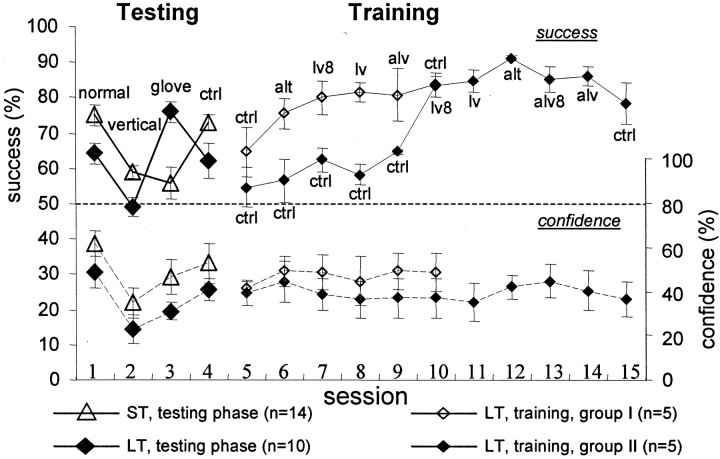
Fig. 8.
Effect of training and guidance on success rates and confidence levels during the scanning of the low-amplitude 48 sets of gratings. Mean ± SEM of success rates (solid lines) and confidence levels (dashed lines) are depicted. Trials were 4 sec long, unless mentioned otherwise.Filled diamonds, LT subjects, testing phase (n = 10 for sessions 1–3; n = 7 for session 4). Open triangles, ST subjects, testing phase (n = 14 for sessions 1–3;n = 10 for session 4). Open diamonds, LT subjects (n = 5), training phase; these subjects performed a normal control session (session 5) and then were trained with guidance in the following sequence of sessions: 6, alternating scanning (alt); 7, low velocity (8 sec trials; lv8); 8, low velocity (lv); 9, alternating scanning with low velocity (alv); and 10, a normal control (ctrl). Filled diamonds, LT subjects (n = 5), training phase; these subjects performed five normal sessions without guidance after completing the testing phase (sessions 5–9; ctrl) and then were trained with guidance for additional five sessions: 10, low velocity (8 sec trials; lv8); 11, low velocity (lv); 12, alternating scanning (alt); 13, alternating scanning with low velocity (8 sec trials; alv8); 14, alternating scanning with low velocity (alv); and 15, a normal control (ctrl). One of the subjects in the latter group (ga) had success rates of <30% in the first guided session, which indicated a possible systematic reversal of his reports during that session. This session was excluded from the data. Exclusion of the entire data of that subject did not significantly change the average curve depicted in the figure.

