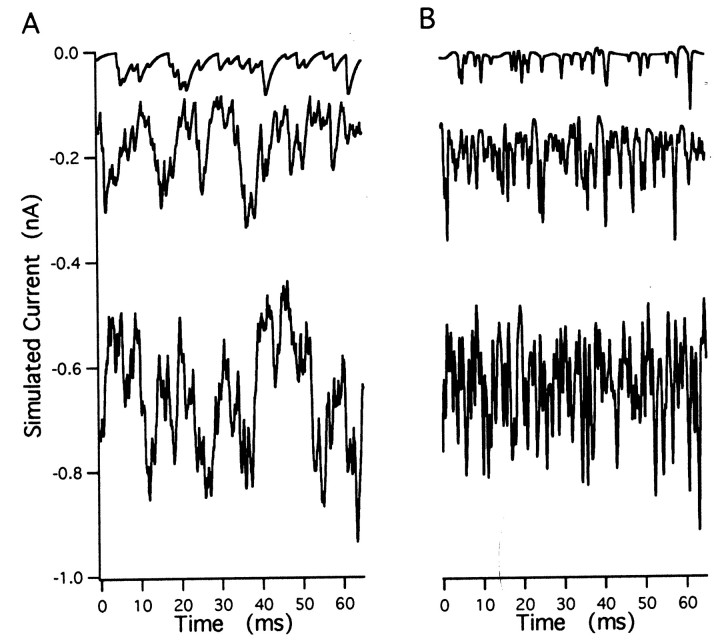
Fig. 2.
Simulated current traces. A, Excerpts from simulated traces at rates of 0.5 (top), 2 (middle), and 8 (bottom) events/msec. mEPSCs had rise time constants of 0.2 msec, decay time constants of 2 msec, and a peak amplitude distribution. B, Same segments of traces as in A after bandpass filtering. Traces are offset to match the DC level of the corresponding traces in A.

