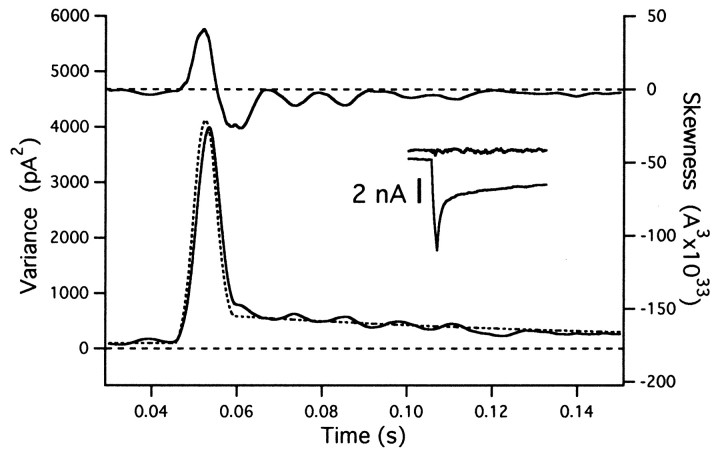
Fig. 5.
Mean subtraction and trace-to-trace fluctuations. The estimate for variance (bottom curve) is remarkably insensitive to small fluctuations between traces, whereas skewness (top trace) is distorted. The rate function was multiplied by a scaler that varied randomly between 0.8 and 1.2, before starting the simulation of individual traces. The mean of 10 traces was calculated, and an ensemble noise analysis was performed as described in Materials and Methods (Eqs. 18 and 19), with the scaler for the mean subtraction optimized for each individual record. The figure shows the time window (between 30 and 150 msec) during which the mEPSC rate rises abruptly to a value of 100 events/msec for a period of 5 msec. Estimates for variance and skew, as well as the mean rate function, were averaged over a sliding window 5 msec in length. Thestippled curve is the smoothed rate function, scaled such that rate and variance are expected to agree. The insetshows the average current trace and an example for an individual difference trace (same time window as other traces).

