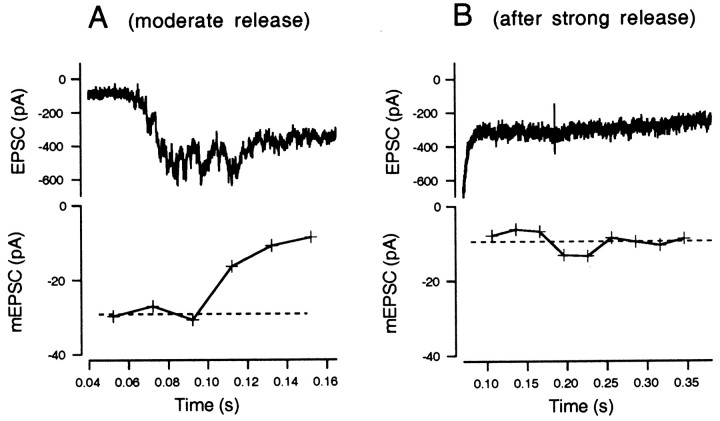
Fig. 7.
mEPSC amplitudes estimated during periods of moderate release. A, An exemplar EPSC trace during moderate stimulation (0.04–0.16 sec in Fig. 6A) is displayed at expanded scale (top). In the bottom, mEPSCs amplitudes calculated from means of 10 traces of skewness and variance are plotted. The dotted line indicates the mean mEPSC amplitude during the initial periods of moderate release, which is −29.2 pA. B, An exemplar EPSC after strong stimulation (from Fig. 6B; 0.1–0.35 sec) is displayed at expanded scale (top). In the bottom, mEPSC amplitudes, calculated from skewness and variance as in A, are plotted. The dotted line indicates the mean mEPSC amplitude, which is −9.5 pA.

