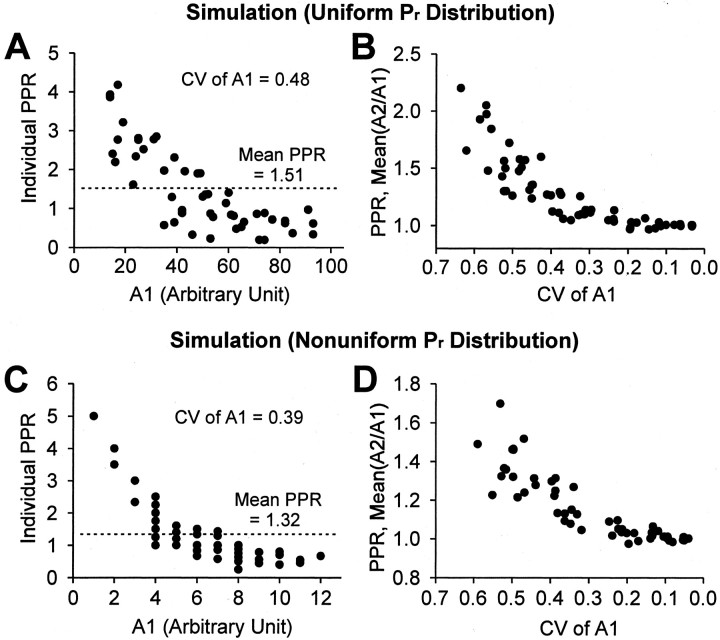
Fig. 1.
Simulation of paired-pulse ratios (PPRs) by means of randomly generated numbers. Simulated PPRs were generated assuming that the distribution of Pr across the simulated population is either uniform (A,B) or nonuniform (C, D).A, To test whether spurious PPF can be obtained by the simple occurrence of random numbers, we generated 50 pairs of random numbers between 10 and 100 and took the ratio (simulated PPR) of the second (A2) to the first (A1). When PPR is plotted against A1, the result resembles the output of a use-dependent process. The mean of the PPRs of this trace group is 1.51. B, Spurious PPF is related to the CV of the distribution of sampled random numbers. We varied the CV by restricting the range of random numbers that were sampled and plotted the means of trace groups generated as inA; one dot represents the mean PPR of one trace group. The least variable numbers were generated between 90 and 100, and the most variable numbers were generated between 5 and 100. Spurious PPF increased monotonically as the CV of the population of sampled numbers increased. In all figures CV is given as its absolute value and is plotted as descending to the right to emphasize that large values of CV are associated with small response sizes. C, D, The analysis is the same as in A and B except that a nonuniformPr distribution of a population of simulated synapses was modeled with a Γ density function (see Materials and Methods). Simulation of probabilistic release was accomplished by comparing an assigned Pr at a synapse with a randomly generated number between 0 and 1; ifPr was greater than a random number, then a release was counted. C, Fifty pairs of random responses were generated from a Γ distribution ofPr, with a mean of 0.033 (to simulate low Pr conditions) and individualPr values distributed across 200 synapses. Note again the inverse relationship between simulated PPR and A1. The mean PPR of this simulated trace group is 1.32. D, CVs of the nonuniform Pr distributions were varied by varying the mean Pr of the Γ distributions (from 0.013 to 0.645). Again, spurious PPF increases with increasing the CV of simulated responses.

