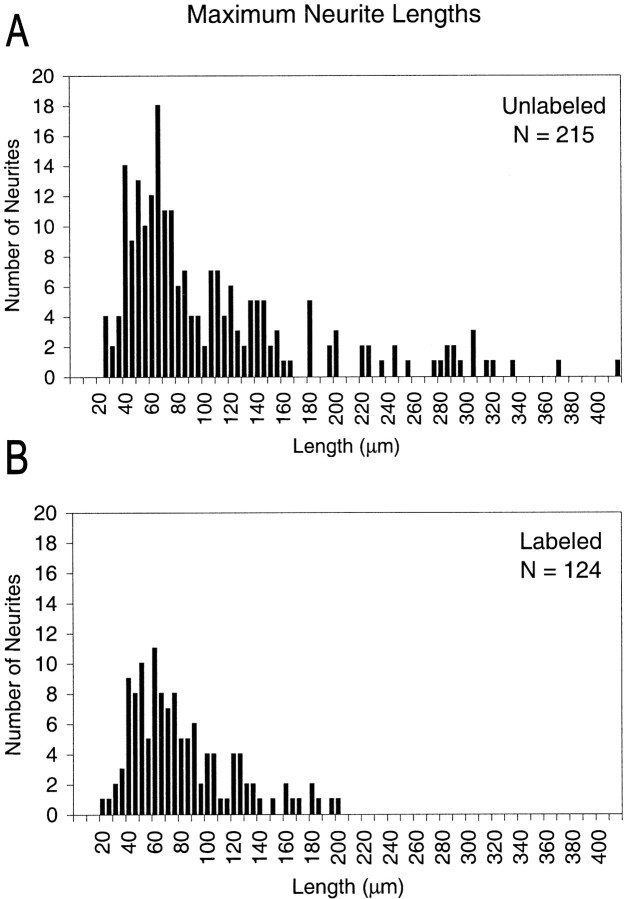
Fig. 4.
Distributions of the maximum lengths (in micrometers) achieved during the time-lapse observation period by the longest neuritic branch of each neuron from anti-NF-M-injected embryos. Distributions of labeled (A) and unlabeled (B) neurons are shown separately. The total number (N) of neurons in each category is indicated in the top right corner of each panel.

