
Fig. 5.
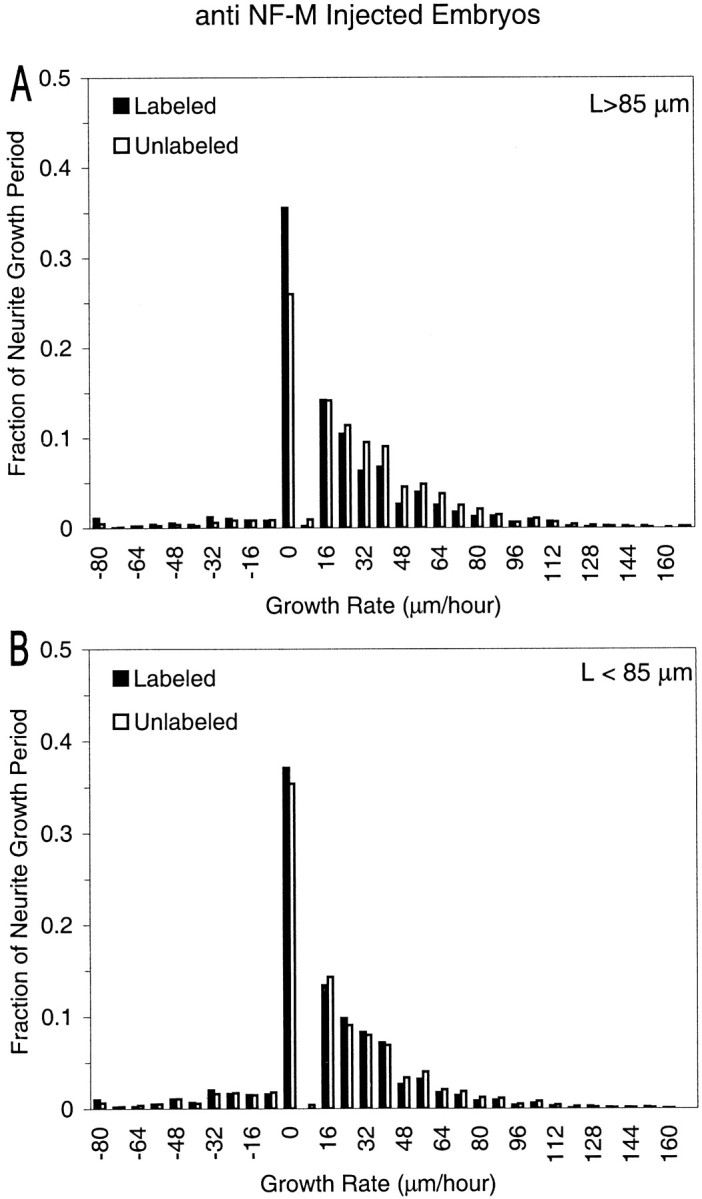
Distributions of neuritic extension velocities in anti-NF-M-injected embryos, normalized over the growth period. The growth velocity between 10 min time frames was calculated from the distance traveled by the tip of the principal neuritic branch. To obtain the fraction of the neurite growth period (y-axis) that each neurite spent moving at a given velocity (x-axis), the amount of time (number of frames × 10 min per frame) a neurite spent at a particular velocity was divided by the total length of the growth period for that neurite. These values were then averaged over all neurites in a given category [i.e., labeled (black) or unlabeled (white) and plotted separately for long (maximum length >85 μm; A) and short (maximum length <85 μm;B) neurites]. The number of neurites in each category is the same as in Table 1. Positive and negative velocities indicate extensions and retractions, respectively.