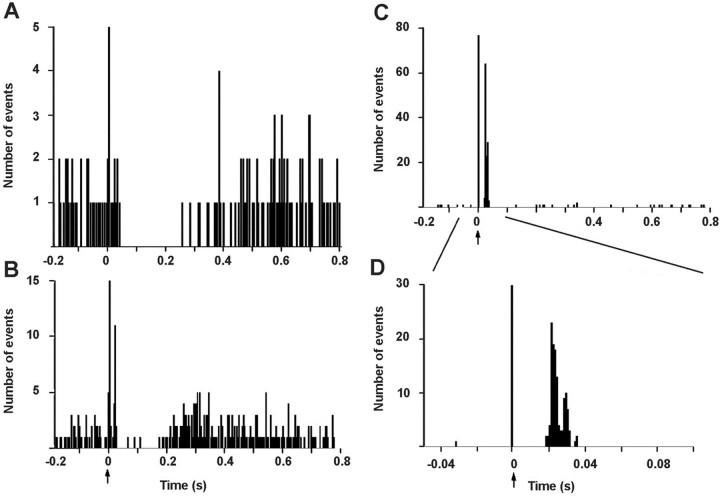
Fig. 2.
Typical examples of responses of DR neurons to the electrical stimulation of the mPFC. A shows a PSTH corresponding to an inhibition of a 5-HT neuron. B shows a PSTH in which a subthreshold activation (9%) occurred before inhibition. C and D show an orthodromic activation of a 5-HT neuron (note the different time scale and bin size in D). The arrow indicates the stimulus artifact. PSTH made up of 250 consecutive trials of single pulse stimuli (0.2 msec, 1 mA) delivered at 0.9 Hz. Bin width 4 msec (A–C) and 1 msec (D). Note the different ordinate scale in A and Bversus C and D.

