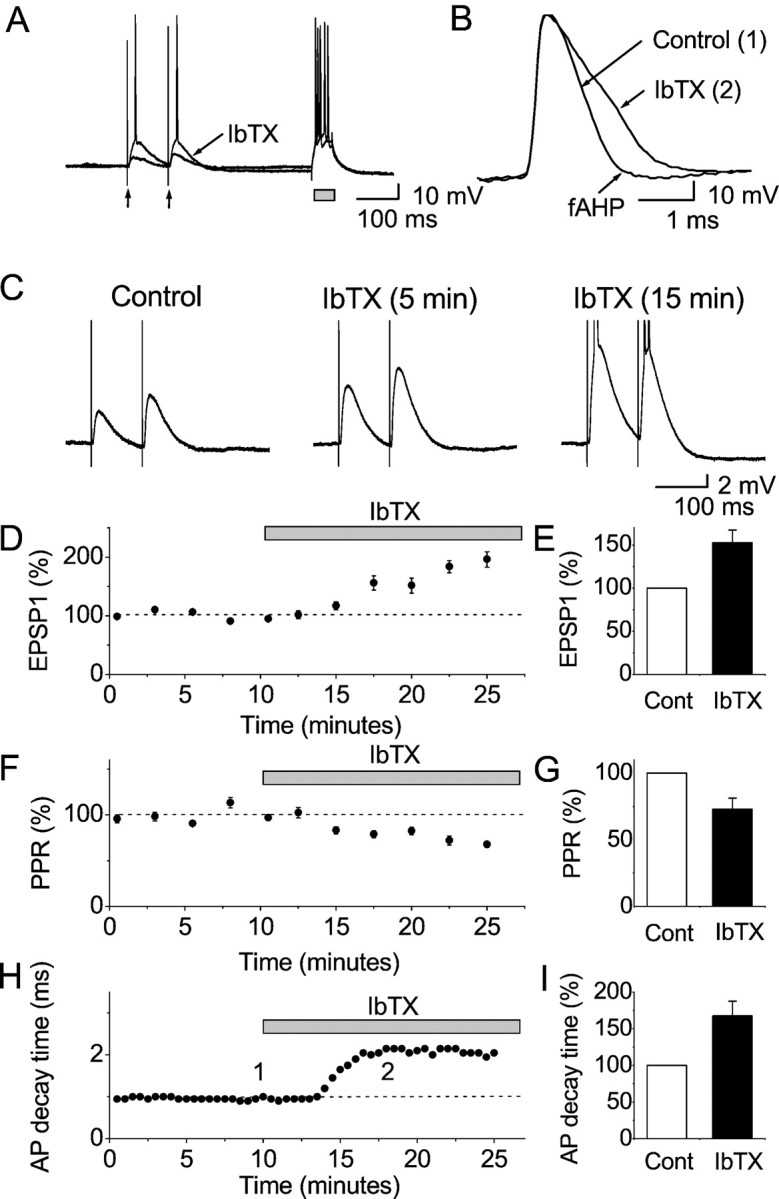
Fig. 3.

Effects of BK channel blockade by iberiotoxin (IbTX) on synaptic transmission and action potentials in CA1 pyramidal cells, after K+ channel blockade by 4-AP; whole-cell recording. A, EPSPs in response to activation of presynaptic fibers in stratum radiatum by a pair of electrical stimuli (arrows), recorded in the continuous presence of 100 μm 4-AP. The resting membrane potential was adjusted to −70 mV by steady current injection, and action potential trains were evoked by injecting a 50-msec-long depolarizing current pulse (gray box). The stimuli were repeated once every 30 sec. Representative single traces before and after bath application of 100 nm IbTX are shown superimposed. B, Representative records of the first action potential in trains evoked by depolarizing current pulses, as shown in A, before and after application of 100 nm IbTX, shown superimposed. Note the characteristic spike broadening by IbTX. C, Typical EPSPs from a cell before and after (5 and 15 min) application of 100 nmIbTX (average of 5 consecutive records). IbTX caused a progressive increase in the EPSP amplitudes, until action potentials were evoked.D, Summary time course of the EPSP amplitude (first EPSP in the pair, normalized to the amplitude at the beginning of the control period) in response to 100 nm IbTX for all whole-cell recordings in 4-AP (n = 5 cells). Stimulation was repeated once every 30 sec, and the average responses for 2.5 min periods are plotted. When EPSPs triggered spikes (in IbTX), the maximal subthreshold EPSP amplitude was used. E, Summary data (mean ± SEM) of the EPSP amplitude (first EPSP in the pair, normalized to the control period) in response to 100 nm IbTX, showing a significant difference (p = 0.011; n = 5 cells). F, Summary time course of the paired-pulse ratio (PPR) (second EPSP/first EPSP, normalized to the ratio during the control period) in response to 100 nm IbTX for all whole-cell recordings (n = 5 cells). Stimulation was repeated once every 30 sec, and the response for each 2.5 min period is plotted. G, Summary diagram of the effect of IbTX on the PPR, showing a significant difference (p = 0.025; n = 5 cells). H, Time course of the spike broadening caused by IbTX, expressed as the action potential 90–10% decay time, for the cell illustrated inA–C. Values are plotted for the first action potential in each spike train, evoked every 30 sec by a depolarizing current pulse (A, B).I, Summary data of the action potential decay time (first spike in the train, normalized to the control period) in response to 100 nm IbTX, showing a significant difference (p = 0.017; n = 5 cells). All diagrams (D–I) show mean ± SEM normalized to the control period.
