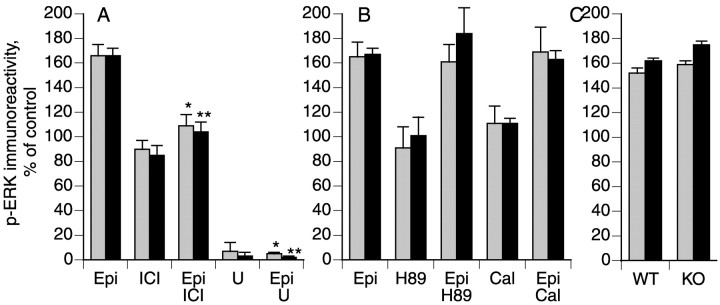
Fig. 2.
Epinephrine-induced phosphorylation of ERK1 (gray bars) and ERK2 (black bars) is reduced by inhibitors of β2-adrenergic receptors and MEK and is independent of PKA and PKCε. A, DRG cultures were treated with 1 μm epinephrine (Epi; n = 9) for 5 min in the absence or presence of (A) ICI 118,551 (ICI; 100 nm; n = 7) or U0126 (U; 10 μm; n = 2). B, Cultures were treated with 1 μmepinephrine (Epi; n = 11) for 5 min in the absence or presence of H89 (1 μm;n = 5) or calphostin C (Cal; 1 μm; n = 7). C, DRGs cultured from PKCε wild-type (WT) or knock-out (KO) mice were treated with 1 μmepinephrine for 5 min (n = 3). Data are mean ± SE values. *p < 0.05 compared with phospho-ERK1 in epinephrine-treated cells; **p < 0.05 compared with phospho-ERK2 measured in epinephrine-treated cells (one-way ANOVA and Tukey's multiple comparison test).

