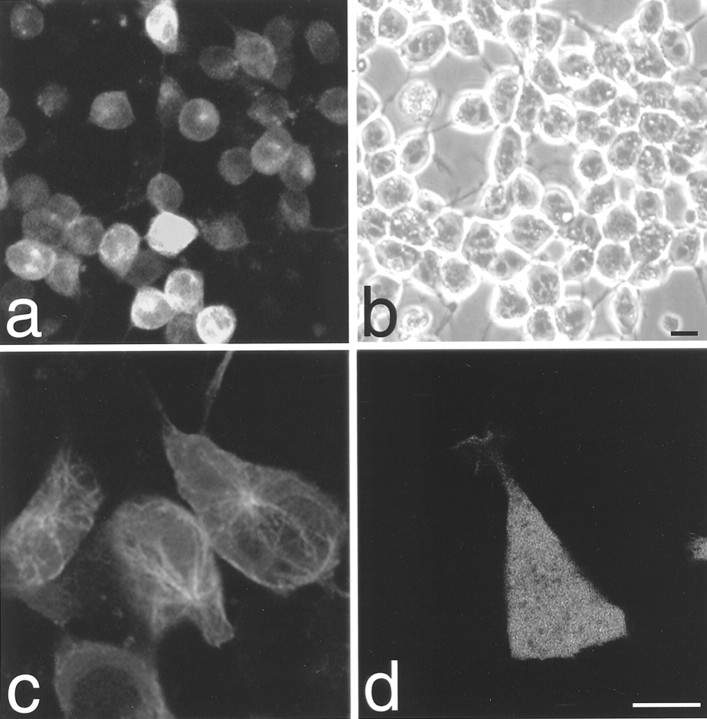
Fig. 1.
Confocal image analysis of undifferentiated P19 living cell lines. a, Field view of a selected stable cell line transfected with GFP-tau–cod-H construct. b, Phase view of a. Because the photograph shows living cells, not all of the cells in the field are in the same plane; hence, the differences observed in the intensity of GFP fluorescence. Scale bar, 50 μm. c, Distribution of tau protein on MTs in the stable cell line transfected with the GFP-tau–cod-H construct. d, Distribution of P19 cells transiently transfected with the GFP vector alone. Scale bar, 5 μm.

