
Fig. 8.
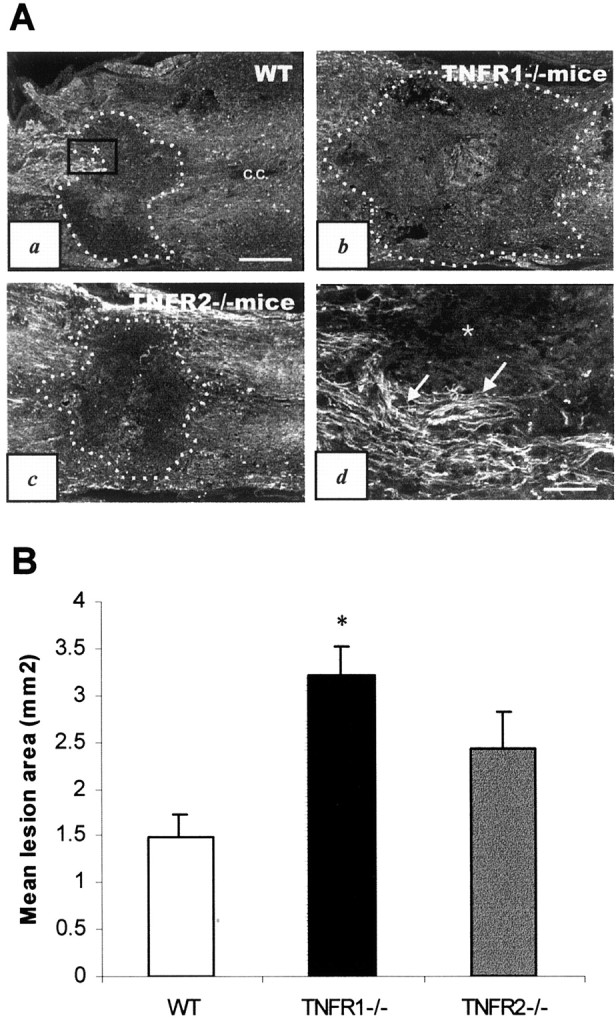
Axonal disruption in TNFR-deficient mice after SCI. A, Representative photomicrographs illustrating spinal cord lesion areas defined by neurofilament (SMI-31) immunostaining in B6 (a), TNFR1−/− (b), and TNFR2−/− (c) mice 7 d after SCI. All sections were cut longitudinally through the central canal (c.c.) for comparison. Dotted linesdelineating the lesion areas are based on SMI-31 immunoreactivity.d, High power view of the boxed area ina that demarcates the border between intact cord tissue (arrows) and the lesion area (asterisk). Scale bars: a–c, 400 μm; d, 100 μm.B, A histogram showing the mean lesion area among the three experimental groups (n = 3 per group). *Significant difference from the wild-type (WT) control (p < 0.02).