
Fig. 1.
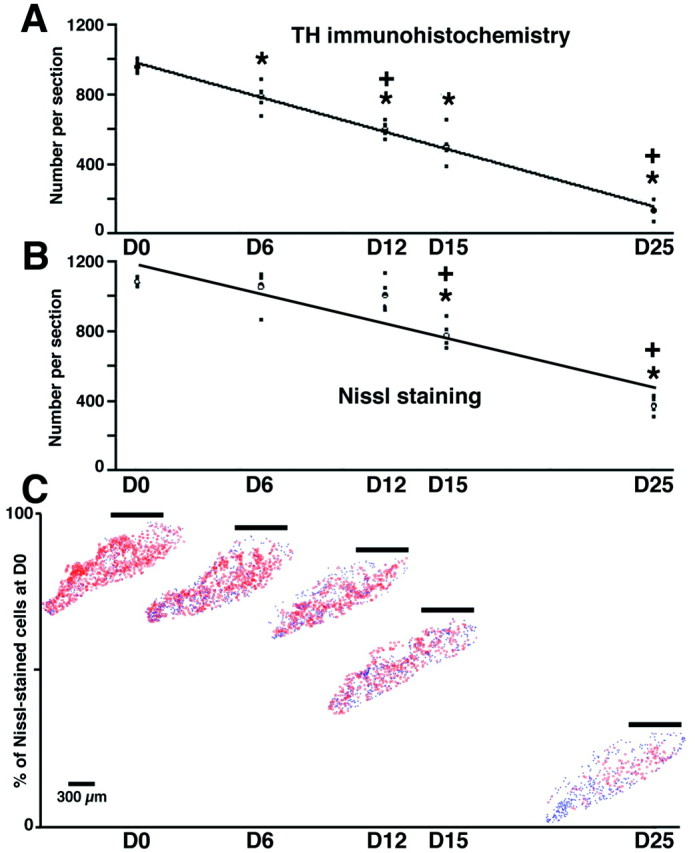
Time course of changes in the number of TH-IR neurons (A) and Nissl-stained cells (B) in the SNc. A,B,Filled squares represent the individual values (n = 5 in each group), theopen circle represents the mean value of each group, and the dark lines represent the kinetic fits. *Significant difference compared with D0, p < 0.05; +significant difference compared with the previous group,p < 0.05. C, Examples of cell-counting maps showing the typical patterns of degeneration in the SNc. TH-IR neurons are marked in red, whereas theblue symbols represent the Nissl-stained cells that were not TH-positive. The horizontal line above each map indicates the mean percentage of surviving cells (i.e., Nissl-stained). Note the selective disappearance of the dorsal tier of the SNc with time.