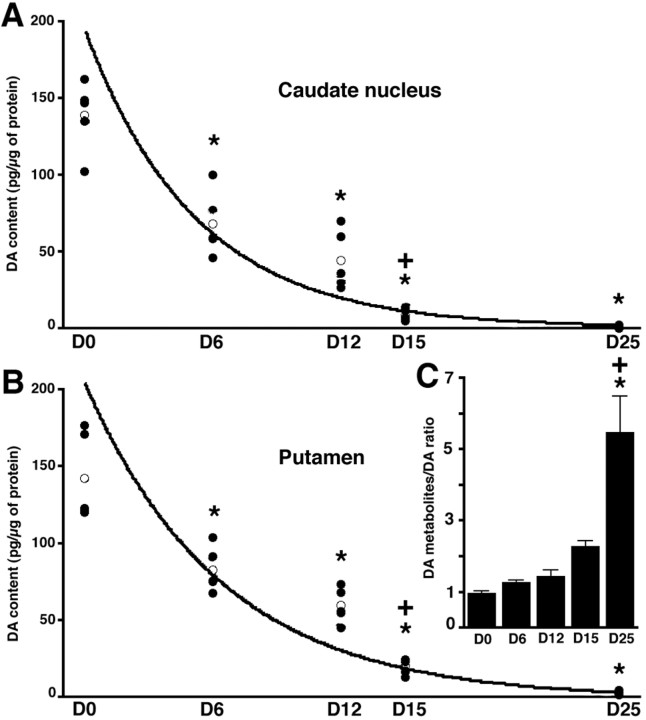
Fig. 3.
Progressive decrease in striatal DA content (in picograms per microgram of protein) measured in the caudate nucleus (A) and in the putamen (B).Filled circles represent the individual values (n = 5 in D0, D12, D15, and D25 groups andn = 4 in D6 group), the open circlerepresents the mean value of each group, and the dark lines represent the kinetic fits. *Significant difference compared with D0, p < 0.05; +significant difference compared with the previous group, p < 0.05. C, Levels of (DOPAC+HVA)/DA ratio in the putamen of the different groups.

