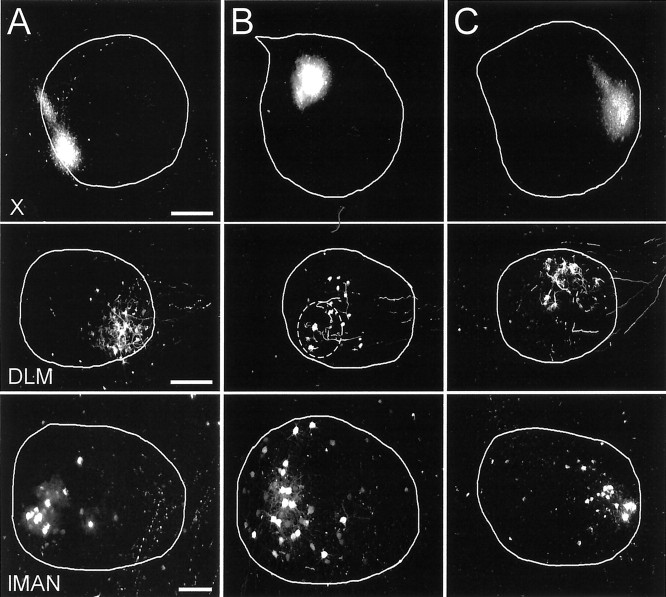
Fig. 3.
Spatial relationships for the X → DLM and lMAN → area X projections demonstrated by three single-tracer injections into different small regions of area X.A, Small tracer injection in posteroventral area X (top) labeled terminals in anteroventral DLM (middle) and somata in ventroposterior lMAN (bottom). B, Small tracer injection in dorsal and slightly posterior area X (top) labeled terminals in ventroposterior DLM (middle) and somata in slightly posterior lMAN (bottom). The dashed circle in the DLM shows the area that includes all of the anterogradely labeled terminals from this injection site. Many retrogradely labeled somata were outside of thecircle. The injection site was in dorsal area X and may have the confounding effect of fibers of passage and thus may have labeled some somata in ventral lMAN. C, Tracer injection in anterior area X (top) labeled terminals in dorsal and slightly anterior DLM (middle) and somata in anterior lMAN (bottom). Scale bars:Top, 400 μm; middle, 200 μm;bottom, 100 μm.

