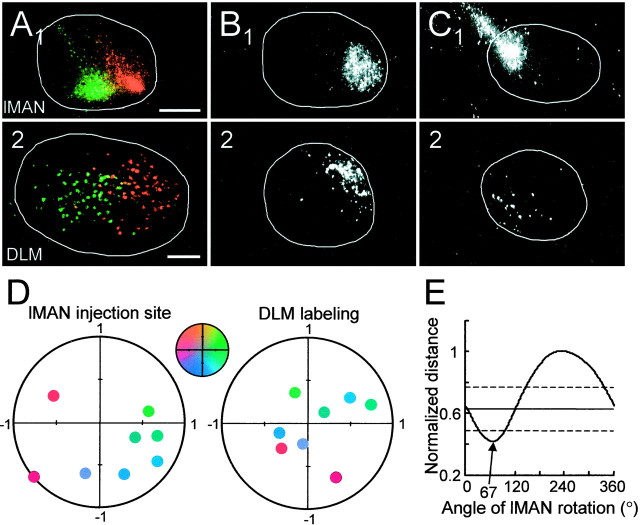
Fig. 5.
The DLM → lMAN projection is topographic in the sagittal plane, with the retrograde labeling rotated ∼67° ccw from its injection site. A1,B1, andC1 are injection sites in lMAN.A2,B2, andC2 show the corresponding retrograde labeling in DLM. A1, Dual-tracer injection into primarily separate areas in lMAN.A2, Primarily separate retrograde labeling in DLM. B1, A single-tracer injection into anterior lMAN. B2, Retrograde labeling in anterodorsal DLM.C1, Single-tracer injection into posterodorsal lMAN. C2, Retrograde labeling in posteroventral DLM. D, Locations of injection sites in lMAN (same color map as in Fig. 4) and the center of corresponding labeling in DLM. E, Optimal matching of the injection site and labeling occurs when the coordinates of lMAN are rotated 67° cw. The solid horizontal line indicates the mean of the minimal distance after the coordinates of the labeling were randomly shuffled. Dashed lines indicate ±2 SDs away from the mean. Scale bars: A1,B1,B2,C1,C2, 200 μm;A2, 100 μm.

