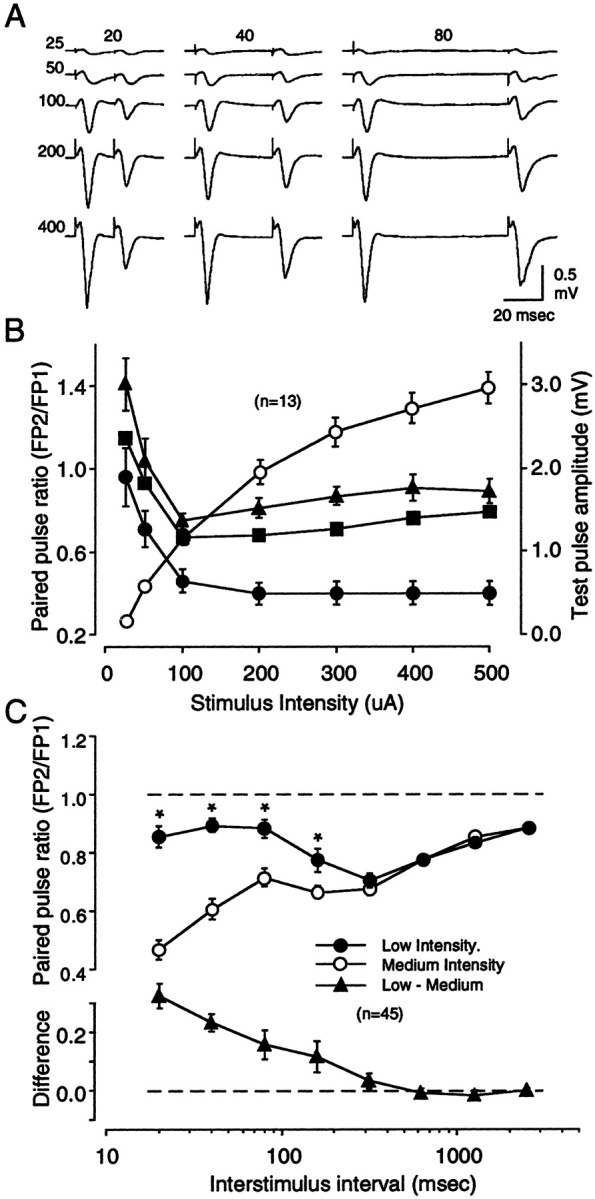
Fig. 5.

Paired-pulse depression depends on stimulus intensity. FPs were recorded in layers II/III in response to WM stimulation. A, Results from a representative experiment showing FPs in response to a series of paired pulses of increasing intensity (25, 50, 100, 200, and 400 μA; orderedvertically) and increasing ISIs (20, 40, and 80 msec; ordered horizontally). Traces are averages of four consecutive responses. B, Summary of 15 experiments performed as in A. The graphshows the relationship between stimulus intensity and paired-pulse response ratio for the three ISIs tested (left y-axis: ● = 20 msec, ▪ = 40 msec, ▴ = 80 msec). Also shown is the relationship between stimulus intensity and the amplitude of the first response (right y-axis: ○). C, The effects of stimulation intensity on PPD are observed only at shorter ISIs. The data in the top panel compare the average response to PPS of the white matter using low and medium stimulation intensities (see Results). In each slice, a complete ISI series (from 20 to 2560 msec) was first delivered at low stimulation intensity (●) and then delivered at medium stimulation intensity (○). ISIs at which the effect of stimulation intensity was significant (0.01 level; see Results) are labeled with an asterisk. The difference in paired-pulse ratio between the two stimulation intensities was computed for each ISI in each experiment. The average results are shown in the bottom panel.
