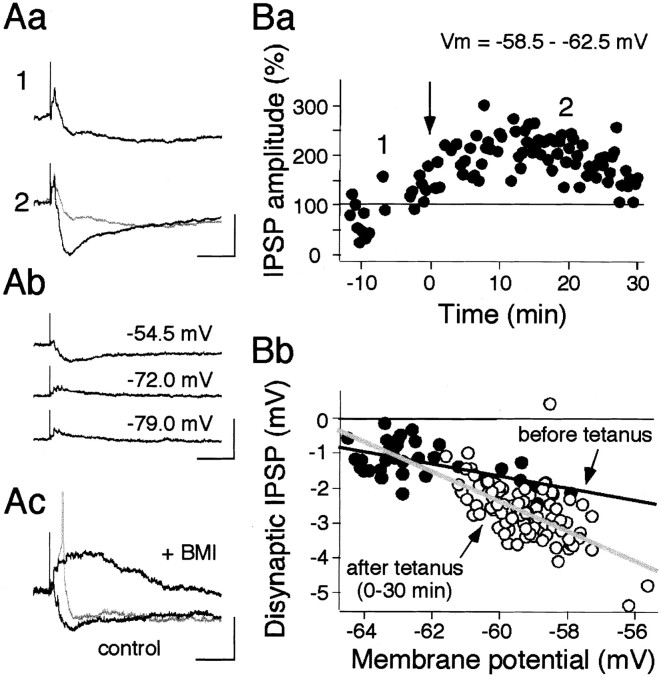
Fig. 5.
Long-term potentiation of disynaptic IPSP in cholinergic neurons. Aa, Evoked postsynaptic potentials by a test stimulus (250 μA, 100 μsec) containing a large IPSP before (1) and after (2) HFS (100 Hz, 1 sec). Note that the IPSP was significantly augmented.Ab, Reversal of disynaptic IPSP. Postsynaptic potentials were recorded at the membrane potential shown beside eachtrace. Ac, BMI (30 μm) abolished the IPSP and unmasked a large depolarizing plateau potential (+BMI), which occasionally triggered an action potential (gray trace). Calibration: 1 mV (Aa), 10 mV (Ab), 5 mV (Ac); 100 msec (Aa, Ab,Ac). Ba, LTP of disynaptic IPSP. Peak IPSP amplitudes, measured from onset to peak at membrane potentials of −58.5 to −62.5 mV, are plotted against time for a single cell. IPSPs evoked at membrane potentials outside the range of −58.5 to −62.5 mV were omitted from the graph. Bb, IPSP amplitudes are plotted as a function of membrane potential, at which each IPSP was obtained before (●) and after (○) tetanic stimulation, and are fitted with a linear regression. The line fit for data before tetanus (black line) intersects the line for data after tetanus (gray line) at approximately −63 mV, which is close to the equilibrium potential of Cl− (−59 mV) in this recording configuration. Note that evoked IPSPs before tetanus are smaller than those after tetanus at around resting membrane potentials of this cell (approximately −60 mV).

