Fig. 1.
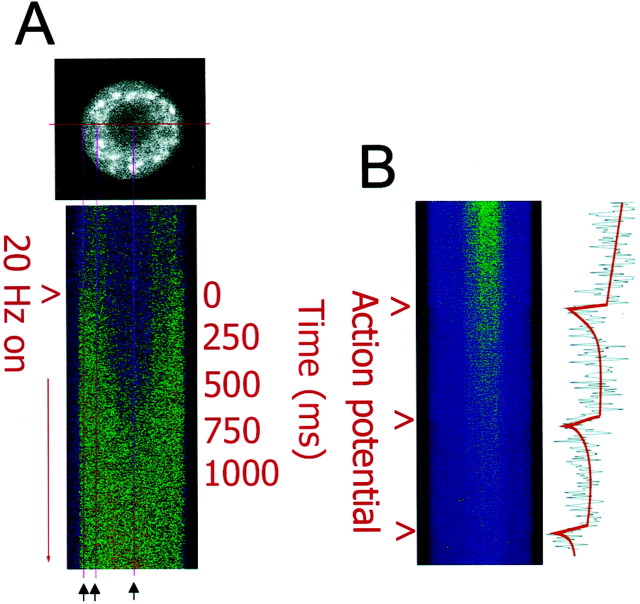
High-speed measurements of action potential-induced changes in intracellular calcium in DRG neurons using confocal microscopy in single line-scan mode. A, An optical section of a single mouse DRG neuron is shown loaded with the calcium indicator fluo-3 (black and white image). The excitation laser was scanned repeatedly through the center of the cell, and data were acquired at a rate of 8 msec/scan and displayed as a stack of sequential scans. Changes in intracellular calcium induced by action potential stimulation are shown for 250 sequential samples (2 sec total). Thus, the vertical dimension displays changes in calcium concentration with time, and the horizontal dimension displays one-dimensional spatial information on the calcium concentration along a transect across the center of the neuronal cell body. Measurements were taken in response to 0.1–30 Hz stimulation; the response to 20 Hz stimulation is shown here. Electrical stimulation caused an influx of calcium from the cell membrane and the increase in intracellular calcium propagated to the nucleus within ∼200 msec. Intracellular calcium concentration reached similar peak levels in the cytoplasm and nucleus. The three vertical magenta linesindicate the regions used for quantitative comparisons (black arrows). B, The increase in intracellular calcium concentration induced by single action potentials could be resolved with single line-scan measurements. Fluorescence intensity at 460 nm emission is shown from a DRG neuron filled with the calcium indicator indo-1. This indicator exhibits a decrease in fluorescence intensity with increasing calcium concentration at this emission wavelength. The ratio of such images at 460 and 405 nm emission wavelengths was used for quantitative analysis, as shown in Figure2G. The increase in intracellular calcium induced by an action potential lasted ∼300 msec after each action potential, and the kinetics of increase were much faster than the recovery to resting calcium levels. Scale bar, 10 μm.

