Fig. 3.
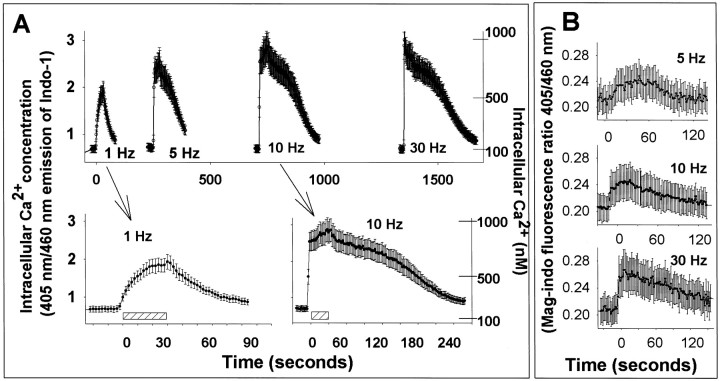
The concentration dynamics of electrically evoked intracellular Ca2+ concentration varied directly with the stimulus frequency. A, Changes in cytoplasmic calcium were measured by confocal microscopy using the ratiometric fluorescent calcium indicator indo-1/AM. The rate of rise, peak, concentration, and duration of Ca2+ increase were positively correlated with stimulus frequency between 1 and 30 Hz. Data for 1 and 10 Hz are shown as insets on an expanded time scale. Results shown are mean ± SEM (n = 12 neurons). Scale bar, 30 sec stimulation. B, Similar responses are observed using the low-affinity indicator mag-indo-1, which is less sensitive to small changes in intracellular calcium.

