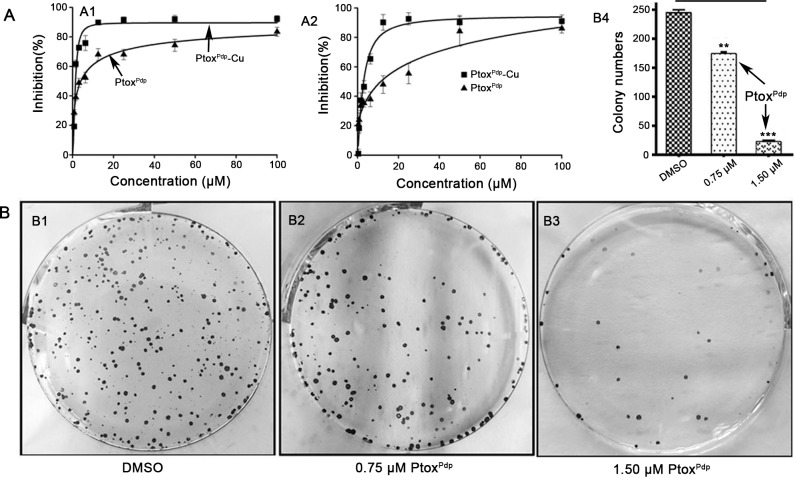
Fig 3. Inhibition of growth and colony formation by PtoxPdp.
(A) Growth inhibition by PtoxPdp of the different hepatocellular carcinoma cells lines. The IC50s for PtoxPdp and PtoxPdp-Cu were 3.89 ± 0.51 and 1.52 ± 0.20 μM against HepG2 cells, respectively; and 11.01 ± 0.63 and 2.95 ± 0.40 μM against HCCLM3 cells, respectively. (B) Inhibition of HepG2 cell colony formation by the different indicated concentrations of PtoxPdp; the static data are shown in columns (**P < 0.05; ***P < 0.001).

